When to Pivot Your Startup: 6 Measurable Signals
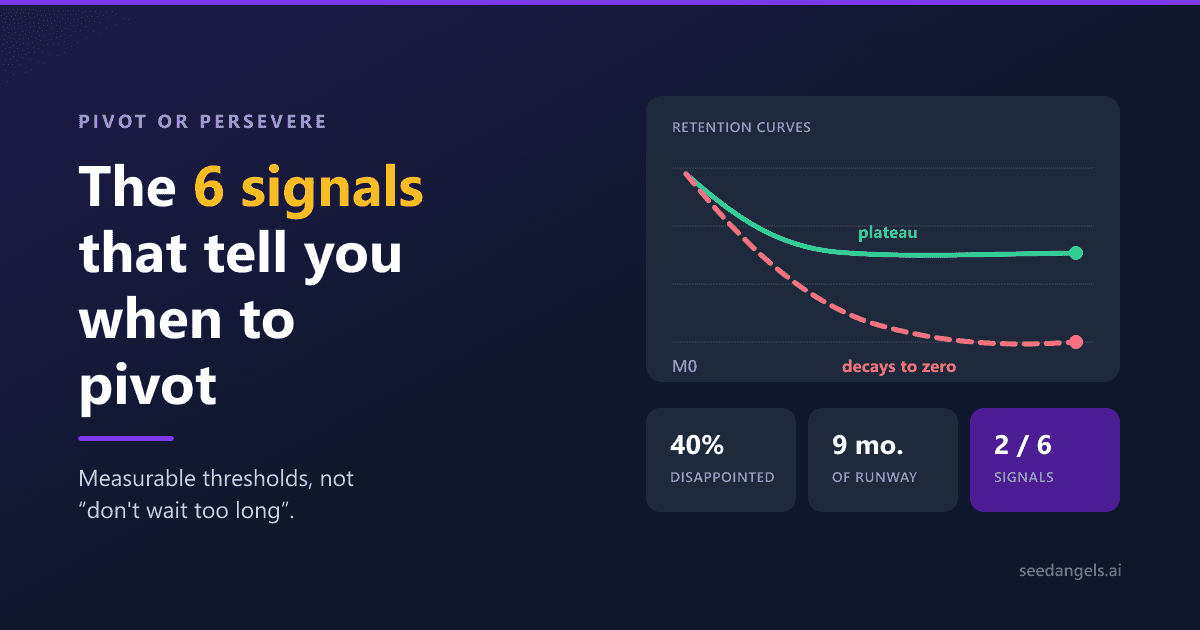
Table of contents
- The threshold nobody gives you
- Pivot or iteration: the confusion that costs most
- The 6 measurable signals
- The 2-out-of-6 rule
- Which pivot type for which signal
- The timeline: neither too early nor too late
- Pivoting without throwing everything away
- Conclusion
- FAQ
The threshold nobody gives you
Knowing when to pivot is not a courage problem, it is a measurement problem. A founder who pivots too early never learns anything from what they just built: they change hypothesis before holding the data that would say whether the first one held. A founder who pivots too late is right on substance and no longer has the cash to fund the turn.
Between those two, most writing on the subject answers "not too early, not too late," "don't wait too long," "give it a quarter." None of that can be applied on a Monday morning in front of your dashboard.
This article does the opposite: six measurable signals, each with an explicit threshold, a composite trigger rule so you do not pivot on one bad month, Eric Ries's ten pivot types mapped onto each signal, and a realistic timeline. By the end you will know whether to pivot, which pivot type matches your diagnosis, and what you still have to measure before calling it.
One warning first: none of these thresholds is an automatic verdict. They are triggers for analysis. They tell you when the question deserves to be opened, not what answer to give it.
Pivot or iteration: the confusion that costs most
A pivot changes a structural hypothesis in your venture: the customer you target, the problem you address, or the way you capture value. An iteration improves execution on a hypothesis you keep. The practical consequence is immediate: you do not pivot because a feature disappoints, you pivot because a hypothesis has been invalidated.
Following Eric Ries, OpenClassrooms defines a pivot as a structured course correction designed to test a new hypothesis about the product and the business model. "Structured" is the operative word: a pivot is not a change of mood, it is a test you write down before you run it.
| Pivot | Iteration | |
|---|---|---|
| What changes | The target segment, the problem addressed, the business model or the channel | The product, the interface, the message, the price inside the same model |
| What you keep | The team, customer knowledge, the reusable technical foundation | The starting hypothesis, in full |
| Time to evaluate | 3 to 6 months before judging the new hypothesis | 2 to 6 weeks per cycle |
The most common mistake is calling a marketing message change a "pivot." Rewriting your homepage, targeting finance directors instead of IT directors in your campaigns, moving from $29 to $49 a month: those are iterations. They can be excellent, and they put no hypothesis at risk. The test is simple: if you can undo it in one afternoon, it was not a pivot.
The distinction has a direct financial consequence. An iteration is funded inside the current budget. A pivot invalidates your projections: the segment changes, so the price changes, so the volume changes, so the cash plan changes. That is why a pivot is decided with a spreadsheet open, not only in a product meeting.
The 6 measurable signals
You should open the pivot question when at least two measurable signals agree and persist across a full quarter, despite real corrective action. A single signal calls for a targeted fix. Two agreeing signals indicate the problem is no longer in execution but in the hypothesis. Three or more: the question is already settled.
The six signals below all follow the same format: the signal, its numeric threshold, how to measure it concretely, and what crossing it invalidates in your venture. That last point matters most: not every signal points to the same pivot.
| Signal | Trigger threshold | What it invalidates |
|---|---|---|
| Retention that never flattens | Curve decaying toward zero across 3 consecutive cohorts | The problem or the segment |
| The 40% test | Fewer than 40% of users "very disappointed" (min. 40 responses) | Product-market fit on this segment |
| Acquisition cost | CAC > lifetime value for more than 12 months, with no improvement | The channel, the price or the segment |
| Sales cycle | No shortening after 10 to 15 closed deals | The segment (problem is not a priority) |
| Customer feedback | No unprompted follow-ups, no specific requests, no unplanned usage | The intensity of the need |
| Runway | Under 9 months of cash without traction | The timeline, not the hypothesis |
Signal 1: retention never flattens
The threshold: a retention curve that decays toward zero instead of stabilising on a plateau, observed across at least three consecutive cohorts. A cohort is the group of users who arrived in the same period - a month, a week - and that you then track over time. Retention measures how much of that group is still active N days or N months later.
How to measure it: build a two-way table, one row per monthly cohort, one column per month elapsed since signup. Read each row left to right. Two shapes exist and only one is viable. The healthy curve drops fast in the first weeks, then settles on a plateau: you lose the curious and keep a core. The dead curve drops and keeps dropping to zero, whatever plateau you were hoping for.
What it invalidates: the problem itself, or the segment you address it to. This is the most reliable of the six signals, because it measures behaviour rather than a declaration. If retention still refuses to flatten after several serious product iterations, the hypothesis to question is no longer execution: the problem you address may not be painful enough, or you are addressing it to people who do not feel it strongly enough. Sometimes the venture also belongs to a structurally trapped category of idea - a family of problems that has attracted founders for twenty years without anyone succeeding at them.
Signal 2: fewer than 40% of users "very disappointed"
The threshold: fewer than 40% "very disappointed" answers to the question "How would you feel if you could no longer use this product?" This is the test attributed to Sean Ellis, who calibrated it after asking it inside hundreds of companies: a company typically had product/market fit if about 40% of users said they would be very disappointed without the product.
How to measure it: ask active users only, with three answer options - very disappointed, somewhat disappointed, not disappointed. Surveying dormant signups distorts everything. The commonly used interpretation bands are these: below 25%, the product has not found its market; between 25 and 40%, you are close but not there; above 40%, fit is likely. One sample constraint not to skip: count on 40 responses minimum for the threshold to carry statistical meaning, and 100 or more before drawing a pivot decision from it.
The decisive caveat: Sean Ellis himself qualifies his own test. He notes that the question is a good leading indicator of product/market fit, but that "the obviously more important thing is if people keep using the product." In other words: the 40% test warns you, the retention of signal 1 judges you. If the two contradict each other, believe retention.
What it invalidates: product-market fit on this specific segment. Between 25 and 40%, the right reaction is rarely a pivot: first narrow your audience down to the sub-group that answered "very disappointed" and see whether the score climbs. That is often where the real market is hiding.
Signal 3: acquisition cost never comes down
The threshold: a customer acquisition cost above customer lifetime value for more than 12 months, with no improving trend, after testing several distinct channels. Customer acquisition cost (CAC) is total marketing and sales spend divided by customers won in the period. Lifetime value (LTV) is the total margin a customer leaves you before churning.
How to measure it: calculate both over the last twelve months, channel by channel. What matters is not the instantaneous ratio but its slope. A CAC above LTV at the start is normal: you are paying for your learning. A CAC that does not come down after a year of optimisation and three tested channels is a structural fact.
The mechanism is what makes this signal serious: in that configuration, every new customer makes your position worse. You are not suffering from a growth shortfall, you are suffering from growth that consumes cash. Accelerating is the worst possible reaction.
What it invalidates: the channel, the pricing model, or the segment - in that order of checking. Test a genuinely different channel first, then a materially higher price on a wealthier segment, before concluding that the market itself cannot carry your economics.
Signal 4: the sales cycle stretches instead of shortening
The threshold: a sales cycle that does not shorten after 10 to 15 closed deals, even though your pitch, your demo and your references have objectively improved.
How to measure it: for each signed deal, record the date of first contact and the date of signature. Sort them chronologically and look at the trend. A team that learns sees that delay contract: it qualifies better, it answers objections before they arrive, it knows who not to talk to. If the delay stalls or stretches across fifteen deals, your pitch is not what is at fault.
What it invalidates: the segment. A cycle that refuses to compress almost always signals that the problem you solve is not a priority for the target you chose. Your contacts agree with you, they find it interesting, and the topic sits behind three others in their quarter. The same product sold to a segment for whom the problem is urgent sells twice as fast.
Signal 5: customer feedback is lukewarm and vague
The threshold: qualitative, but perfectly objectifiable. Across a full quarter, no user has contacted you unprompted, no specific feature request has come in, and you have observed no unplanned use of your product. Three absences, not an impression.
How to measure it: keep count, literally. How many unsolicited inbound messages this quarter? How many requests framed with a precise use case, not a "it would be nice to have"? How many times did you discover someone using your tool for something other than what you intended? If all three counters are at zero, the signal is crossed.
Why this is a negative signal: polite enthusiasm is more worrying than criticism. A user who yells at you because a feature broke their workflow is telling you they depend on you. A user who finds your product "really nice" is telling you nothing at all. Repurposed usage is the best of the three clues: it proves someone has a problem strong enough to improvise around it.
What it invalidates: the intensity of the need. You may well have identified a real problem - but one your users cope with perfectly well without you.
Signal 6: runway drops below 9 months without traction
The threshold: less than 9 months of cash ahead of you. Runway is the number of months your current cash funds at your current burn: available cash divided by net monthly consumption.
How to measure it: take your actual cash balance, subtract the receipts you are not certain to collect, and divide by the average of your last three months of net burn. Redo the calculation every month, not every quarter.
Why 9 months: a pivot does not produce results in four weeks. You have to rewrite the hypothesis, rebuild or at least reposition the product, restart acquisition, then give the first cohorts three to six months to say something. Below 9 months, the question is no longer "should we pivot" but "can we still afford to" - and the answer usually runs through a burn reduction before any strategic decision.
Keep the base rates in view rather than the folklore. US Bureau of Labor Statistics data shows that roughly half of private-sector establishments are still operating five years after opening - 51.4% for the cohort that opened in March 2020. Read that as an indicator of the environment, not as a failure rate for your category: it covers all business establishments, not startups specifically. Alarmism is as poor an adviser here as optimism.
What it invalidates: the timeline, not the hypothesis. This is the only one of the six signals that says nothing about whether your venture is right. It only says your decision window is closing.
The 2-out-of-6 rule
Here is the rule we propose for turning those six measurements into a decision, and it has to be presented for what it is: a methodological guardrail proposed by this article, not an industry standard. No study has validated it. Its merit is that it blocks two symmetrical mistakes - pivoting on one bad quarter, and never pivoting because no single signal is ever "clear enough" on its own.
- One signal crossed → fix it, do not pivot. Address the likely cause and re-measure next quarter.
- Two agreeing signals, persisting across a quarter despite real corrective action → formally open the pivot question.
- Three signals or more → the question is no longer whether to pivot, but which one and when.
- Signal 6 alone → that is not a pivot signal, it is a cash signal. Cut burn before deciding anything else.
- Signals 1 and 2 contradicting each other → believe signal 1. Retention is behaviour, the 40% test is a declaration.
- No corrective action taken between two measurements → the quarter does not count. A signal that persists while you tried nothing proves nothing.
Before applying the rule, run the counter-test. Dalton Caldwell, managing director at Y Combinator, frames it from working with more than a thousand startups: if your venture struggles and innovative strategies are exhausted, consider pivoting; but if there are still untapped ideas, persevere and try them first.
That counter-test is more demanding than it looks. Write down the list of things you have never tried: an acquisition channel never tested, an adjacent segment never approached, a price point never offered, an integration never built. If that list holds three credible lines, you have not exhausted your current hypothesis - you have exhausted your patience. Those are not the same thing, and pivoting now would mean abandoning a hypothesis that was never really tested.
Which pivot type for which signal
The reference taxonomy is Eric Ries's, set out in The Lean Startup (2011): ten pivot types, each changing one precise dimension of the model. It is not an in-house framework, and that is exactly its strength - it forces you to name what you are changing, which rules out the "we're changing everything" that can never be evaluated.
The table below maps each of those ten types to the signal that most often triggers it. This is the most actionable part of the article: the same diagnosis does not lead to the same turn.
| Pivot type (Eric Ries) | What changes | Signal it answers |
|---|---|---|
| Zoom-in | A single feature becomes the whole product | Signal 5: one use case concentrates all the interest |
| Zoom-out | The product becomes one feature of a larger whole | Signal 4: the need is too narrow to carry a sale |
| Customer segment | Same product, different target | Signal 4: a sales cycle that refuses to shorten |
| Customer need | Same audience, different problem addressed | Signal 5: loyal audience but a need that is too weak |
| Platform | Moving from an application to a platform, or the reverse | Signal 3: unit CAC will never stand on its own |
| Business architecture | High margin/low volume ↔ low margin/high volume | Signal 3: the economics do not work at current volume |
| Value capture | A change in the monetisation model | Signal 3: real usage but insufficient revenue |
| Engine of growth | Switching between viral, sticky and paid | Signal 3: dependence on an unprofitable paid channel |
| Channel | A change in distribution or sales route | Signal 3: CAC drops on none of the tested channels |
| Technology | Same solution reached through different technology | Signal 3: an unsustainable cost structure |
Three practical readings of this table. Signal 3 feeds five different pivot types: an unmanageable acquisition cost is a symptom, never a diagnosis - you have to go one level down to know whether the channel, the price or the architecture is at fault. Signals 1 and 2, by contrast, appear in no row, and that is deliberate: they invalidate the problem or the segment, so they force a customer segment or customer need pivot, the two heaviest on the list. Finally, zoom-in and zoom-out pivots are the cheapest to attempt, because they keep most of the engineering already written.
The timeline: neither too early nor too late
The thresholds above only mean something relative to your age. The same retention rate does not read the same way in month three and in month twenty.
0 to 6 months of real operation: too early to conclude. Your data is too thin to separate a bad hypothesis from bad execution, and that is precisely the most expensive confusion of this period. Acquisition that does not take off in month four is almost always an execution problem. Measure, fix, do not pivot.
6 to 18 months: the workable window. You have three or four usable cohorts, a dozen documented deals, and enough cash left to fund a turn. This is the window where the 2-out-of-6 rule fully applies.
18 months or more without traction: the question changes nature. It becomes as much about stopping as about pivoting. That is not a personal failure, it is arithmetic: beyond eighteen months a pivot has to be funded, and funding it means convincing someone that the new hypothesis is better than the last - with a track record arguing against you.
How many pivots? There is no quota. The limiting factor is not a number but your cash: a full test cycle - writing the hypothesis, building, acquiring, waiting for cohorts - rarely consumes less than four to six months. In practice that allows two to three serious attempts across eighteen months, no more. This is the moment to rebuild your financial forecast on up-to-date assumptions: the number of turns you can still attempt reads directly from your cash plan, not from your motivation.
One last requirement, worth more than all the rest: every pivot must be preceded by a written hypothesis and a dated success criterion. One sentence is enough: "we believe firms under ten people will pay $90 a month for X; we will know on 15 March if we have twenty paying customers and three-month retention above 60%." Without that, you learn nothing from one pivot to the next - you change your mind, which is not a method.
To put a precise number on the time you have left and test several burn scenarios, SeedAngels builds your cash plan month by month from your real assumptions.
Pivoting without throwing everything away
A successful pivot keeps an asset. That is what separates it from a restart, and it explains why a team that pivots well moves faster than a team that starts fresh. Dalton Caldwell observes it across the Y Combinator portfolio: a successful pivot often means focusing on familiar problems and refining previous solutions, and he cites Brex and Segment, two companies that thrived after a major turn by drawing on their founders' prior experience and on what their first concept had taught them.
Three assets deserve priority protection. Customer knowledge first: the hundred conversations you ran remain valid even if the product changes, provided you recorded what people do rather than only what they said about your idea. The relationship with your existing users next: even a small base of disappointed users is an immediate test channel for the new hypothesis, far faster than cold acquisition. The reusable technical foundation last - infrastructure, integrations, data pipelines - which often represents half the engineering time already spent.
On the other side, two things have to be accepted as lost: the product as it stands, and the founding narrative built around it. The second is harder to let go than the first, because it has been repeated to investors, to hires and to people close to you. Keep defending it and you will carry the constraints of the old hypothesis into the new venture. A pivot starts from a hypothesis to test, not a conviction to defend: it is better to validate the new hypothesis before committing to it with the same protocol you would use for a fresh idea, in a few weeks rather than six months of development.
How to announce it to investors and your team
A documented pivot reassures; a pivot endured worries. The difference lies entirely in how the announcement is structured, in four points and in this order.
- What you learned, with the data: retention curves, the 40% test score, the CAC trend. Start with the facts, never with the conclusion.
- The hypothesis you are invalidating, worded as it appeared in your original plan. Name it explicitly: that is what proves you knew what you were testing.
- The new hypothesis and the assets you are keeping to test it.
- The success criterion and its date. This is the point investors are waiting for, and the one most announcements omit.
Tell them as early as possible, as soon as the two signals are confirmed - not once the new product has shipped. An investor who discovers the pivot after the fact does not remember the turn, they remember that they will not be told next time. Pair the announcement with revised projections: a change of segment moves the price, the volume and the sales cycle, which means rebuilding your revenue forecast rather than trimming the old one at the margins.
Conclusion
Pivoting is neither a failure nor proof of agility. It is a decision taken on data, on a date, with an exit criterion written in advance. What separates founders who come through is not their reaction speed but the quality of what they measure before deciding: retention that refuses to flatten across three cohorts is worth a thousand intuitions, and two agreeing signals are worth more than one bad quarter taken alone.
Go back through the six thresholds, note honestly which ones you have crossed, run Dalton Caldwell's counter-test on the untested ideas, and give yourself a date. If the pivot is decided, it invalidates your previous projections: the financial forecast and the business plan have to be rebuilt on the new hypothesis, not patched at the margins.
Try SeedAngels for free → to rebuild your business plan and forecast on your new hypothesis, or test your starting idea first with our free startup idea validator.
FAQ
When should you pivot your startup?
When at least two measurable signals agree and persist across a full quarter despite real corrective action: retention that never flattens, fewer than 40% of users very disappointed to lose the product, acquisition cost durably above customer lifetime value, a sales cycle that keeps stretching. A single signal calls for a fix, not a pivot.
What is the difference between a pivot and an iteration?
A pivot changes a structural hypothesis: the customer you target, the problem you solve or the business model. An iteration improves execution on a hypothesis you keep. Changing your marketing message or shipping a feature is not a pivot. The distinction matters, because a pivot forces you to rebuild your financial projections from scratch.
How long should you wait before pivoting?
Rarely less than six months of real operation: below that, the data is too thin to separate a bad hypothesis from bad execution. The workable window sits between six and eighteen months, when you hold both solid learning and the cash needed to fund the change.
How many pivots can a startup afford?
There is no quota: your cash is the limit. Each test cycle consumes several months of runway, which in practice allows two to three serious attempts over eighteen months. What ruins you is not the number of pivots but pivots run without a written hypothesis and a dated success criterion.
How do you know whether the problem is the product or the market?
Look at retention. An imperfect product in a real market keeps a loyal core: the curve drops, then stabilises on a plateau. A good product in a market that does not exist sees its curve decay toward zero whatever you improve. In the first case, iterate; in the second, the pivot is about the segment or the problem.
Should you tell investors before you pivot?
Yes, and as early as possible with the data in hand. Present what you learned, the hypothesis you are invalidating, the one you will test next, the success criterion and its date. A documented pivot signals clear thinking; a pivot discovered after the fact damages trust for a long time.
What is the 40% test?
A method attributed to Sean Ellis: ask active users how they would feel if they could no longer use the product. If more than 40% answer very disappointed, product-market fit is likely. You need at least forty responses for the threshold to mean anything, and around a hundred to decide with confidence.
Write your Business Plan in a few clicks
SeedAngels generates a complete, tailored Business Plan (financials, forecasts, pitch) ready to send to your bank or investors.
Try for free →