The hardest line in the business plan
The first line of your forecast is also the hardest to write, and everything else depends on it. Your costs, your funding need, your break-even point, your cash position: every table in the file is derived from the revenue number you put at the top of the column. Get that line wrong by 30 % and the entire document is wrong with it.
The problem is not a shortage of methods. Several exist, they are well documented, and you will find them listed on virtually every business-support site. The problem arrives immediately afterwards: you apply two or three methods to the same project, you get three different numbers, sometimes double one another, and nobody tells you which one to keep.
This article takes the problem from that end. Three methods, one project, all three calculations written out in full, the gap between the results, and the rule that lets you decide. Then how to defend the number you keep in front of a lender who will, without fail, ask where it came from.
What a revenue forecast is (and is not)
A revenue forecast is the estimate of the total sales your business will generate over a coming financial year, excluding tax. It is built from explicit assumptions about volumes and prices, not from a target set in advance. It is the first line of the forecast income statement, and every other line depends on it.
That distinction matters, because the founding mistake is precisely to work backwards: decide the revenue you want, then reverse-engineer the volumes that get you there. The reasoning takes three seconds to spot in a file. It produces implausible assumptions (a 12 % conversion rate, an average basket twice the market level, full capacity by month two) because those assumptions were never calculated, they were adjusted until the total came out right. It is the first of the mistakes that ruin a business plan, and also the easiest for an experienced reader to detect.
You also need to separate revenue from profit. A revenue forecast measures activity, not performance: it says nothing about your margin, your profitability, or your ability to meet your payments. A company can post fast-growing revenue and run out of cash in the same year.
Finally, a revenue forecast is not a prediction. It is a working assumption, revisable, and it should be revised, quarterly through the first year, as real figures come in. You are not committing to an amount, you are committing to a line of reasoning.
Method 1: from demand
The first method starts from the market and works down to you. You size the demand accessible in your area, then estimate the share you can capture. For a shop, that area is drawn in travel time, and a trade area analysis can be run entirely on free public data.
Forecast revenue = accessible market size × capture rate
Take a local market worth $2 M: a 5 % capture rate gives a forecast revenue of $100,000. The mechanism is immediately understandable, and that is exactly what makes it dangerous.
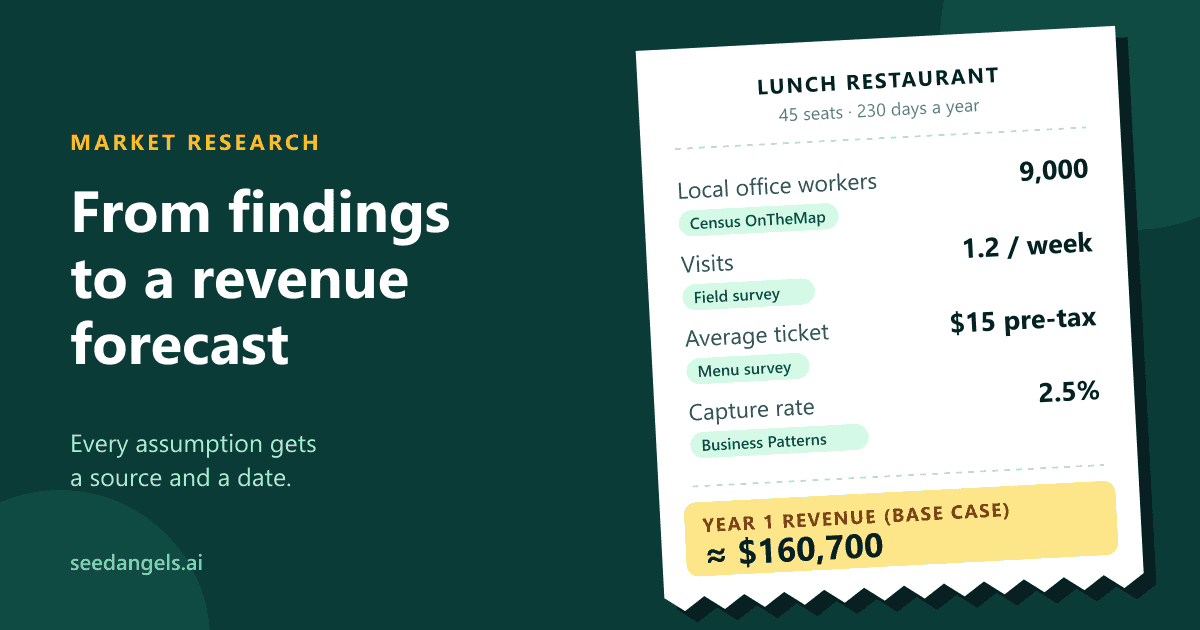
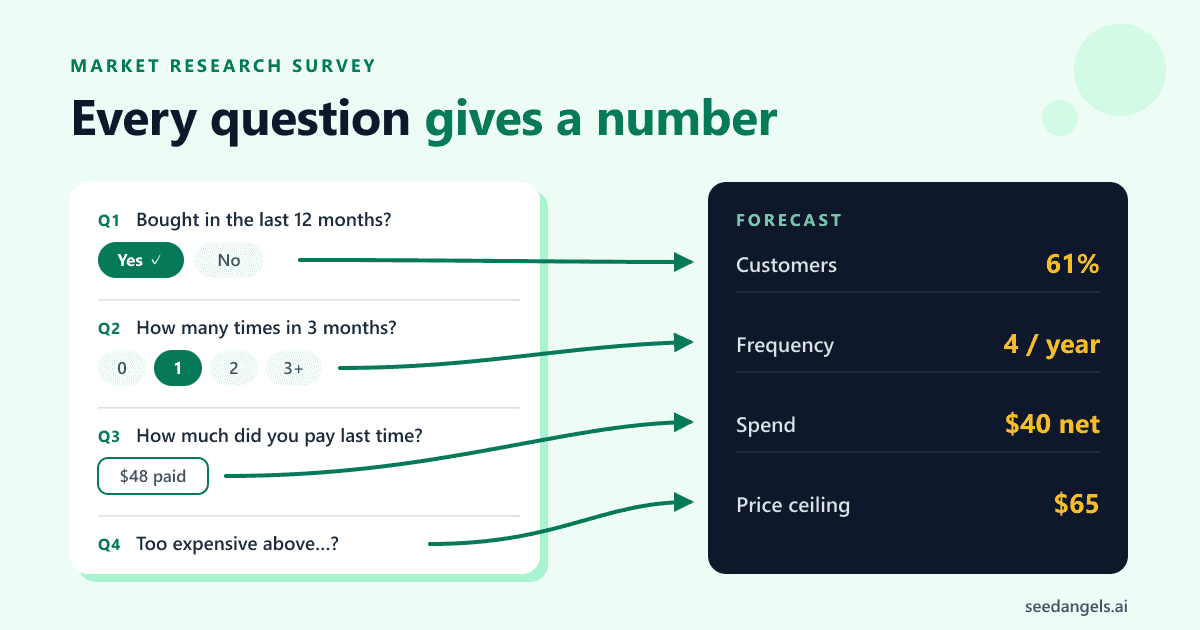
The hard part is the capture rate. One percentage point of difference, on a multi-million market, represents tens of thousands in revenue, and nothing in the calculation forces you to justify that point. In the plans we see, a new entrant with no reputation and no customer base rarely captures more than 1 to 3 % of the accessible local market in its first year: that is a prudence marker, not a norm. But a benchmark is not a justification: it exists to flag an anomaly, not to found a calculation. Market research survey questions built on past purchases give you firmer ground: the share of respondents already buying in the category, how often, and how much they spend.
Sizing the market itself deserves to be done properly, and not at the most flattering perimeter. The question is not "how big is my industry nationally" but "how much demand is genuinely reachable from my location, with my offering and my resources". That is the purpose of the TAM/SAM/SOM method, which we detail in our guide to calculating your market size: the SOM it produces is exactly the accessible market to feed into the formula above. The SBA's guidance on market research and competitive analysis lists the demographic and industry sources that let you build that figure from public data.
This method has one precise use: it sets a ceiling. It tells you the maximum the market can absorb. It does not tell you what you are able to produce, or to sell.
Method 2: from capacity
The second method starts from you and works up to the market. You stop asking what the market can give you and ask what you are physically able to deliver.
Forecast revenue = production capacity × utilization rate × selling price
This is the bottom-up approach, and it is the most reliable for a young business for one simple reason: every one of its terms is verifiable. The number of chairs in a salon, the number of covers in a dining room, the number of working days a consultant has, the output of a machine: these are facts, not estimates. Only the utilization rate remains an assumption, and it is an assumption you can discuss line by line with your counterpart.
The risk lies elsewhere, and it is systematic: forgetting non-billable time. A consultant who counts 220 working days and bills all of them is out by a third. From those 220 days you have to remove prospecting, proposal writing, administration, training, and the gaps between engagements. A 55 to 65 % billing rate is already a good level for an established consulting practice; in year one, with a pipeline still to build, it often falls below 50 %. The same reasoning applies everywhere: a salon does not fill its chairs on a Tuesday morning, a restaurant does not run two full services seven days a week.
So apply the deduction before the calculation, never after. A 100 % utilization rate later corrected by a blanket "prudence margin" is an admission: it means real capacity was never modeled.
Method 3: from comparables
The third method calculates nothing: it observes. You start from what businesses comparable to yours actually achieve, and apply the ratio to your situation.
The most-used ratios are revenue per employee, revenue per square foot of selling space, and average basket multiplied by footfall. The right ratio depends on the sector: floor area makes sense for retail, headcount for a service business, average basket for food service and e-commerce.
This data exists and it is free. Three families of sources cover most needs:
- National statistical offices. In the US, the Economic Census publishes sales and receipts by NAICS industry down to local level every five years, and the Statistics of U.S. Businesses program gives firm counts, employment and payroll by industry and firm size. In Europe, Eurostat's structural business statistics provide turnover by activity and size class.
- Trade associations. Most publish annual benchmark data (average ticket, footfall, occupancy rate) often far more granular than national statistics, and directly usable.
- Published accounts of listed competitors. Segment revenue, revenue per customer and penetration rates are disclosed in annual reports, and they are the closest thing to a verified comparable you will find for free.
The limit of this method comes down to one word: comparability. An industry ratio is an average calculated on established businesses, with a built customer base, local recognition and sometimes years of trading. It describes your steady state, not your first year. Use it as a destination at two or three years, or apply an explicit start-up discount, and say what that discount is.
The worked example: three methods, three results
Let's take one project and run all three calculations to the end.
The project: a 3-chair hair salon, in a mid-sized town, in the town centre. Two full-time stylists plus the founder. Open 6 days a week, 47 weeks a year after holidays. Target average ticket: $40.
The three calculations in full
Method 1, from demand. The catchment area has 24,000 residents. Average annual spend on hairdressing runs at roughly $58 per resident, giving a local market of $1,392,000. The town has 14 salons. A 5 % capture rate gives:
$1,392,000 × 5 % = $69,600
But 5 % for a new entrant with no clientele, facing 14 established salons, is optimistic. At 3 %, closer to first-year benchmarks, you get $41,760. Let's keep the range $42,000 – $70,000, and note that this $28,000 spread comes from a single slider, moved by two points.
Method 2, from capacity. Three chairs, 6 days a week, 47 weeks: 846 chair-days per year. A stylist averages 6 services per day at full load. Theoretical capacity is therefore 5,076 services a year. But year one does not run at full load: Tuesdays and mornings are quiet, and the customer base builds over months. A 60 % utilization rate is realistic, and it is arguable line by line.
846 chair-days × 6 services × 60 % × $40 = $121,800
Method 3, from comparables. The most common industry ratio in hairdressing is revenue per employee, around $58,000 for an established salon. Three full-time people:
3 × $58,000 = $174,000
That is the figure for a salon at steady state. With a 30 % start-up discount, it comes down to $121,800.
| Method | Raw result | After first-year adjustment | What it measures |
|---|---|---|---|
| 1. From demand | $69,600 (at 5 %) | $42,000 – $70,000 | What the market can absorb |
| 2. From capacity | $203,000 (at 100 %) | $121,800 (at 60 %) | What you can produce |
| 3. From comparables | $174,000 | $121,800 (30 % discount) | What your peers achieve |
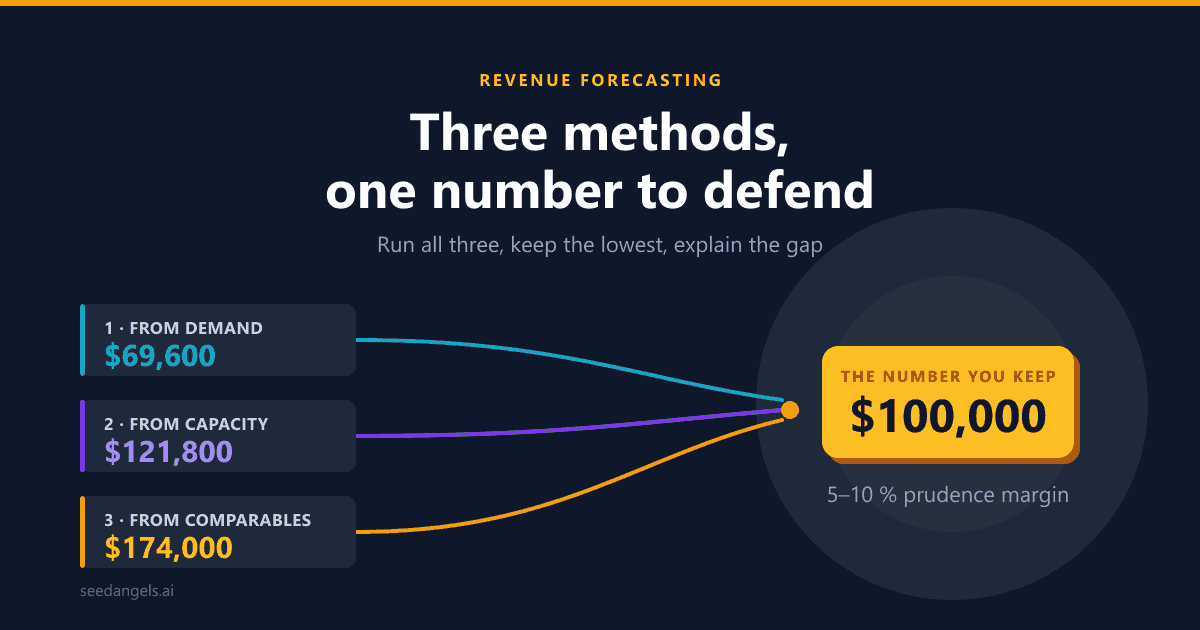
Three serious methods, one project, and a spread that runs three to one.
Why the results diverge
The gap is not a calculation error. It is structural, and it is informative.
The three methods do not measure the same thing. Method 1 measures demand; method 2 measures supply; method 3 measures a stabilized state. Nothing requires them to converge, and the way they diverge tells you about your project.
Here, methods 2 and 3 land in almost exactly the same place ($121,800 twice) despite being built on independent logic. That convergence is a strong signal: your production tool is sized like your peers', and your operating assumptions match the reality of the trade.
Method 1 sits well below, and that is where the information is. Two readings are possible, and you have to choose:
- Either the capture rate is understated. Capturing $121,800 from a $1.39 M market represents 8.7 % of the local market, above the benchmarks. But a well-located town-centre salon, with a real catchment wider than the 24,000 residents assumed, can claim it.
- Or the capacity is oversized. Three chairs in this market may be one chair too many in year one, and the 60 % utilization rate will not be reached.
That tension between the two readings is not a flaw in your file: it is the substance of your risk analysis, and it is exactly what a lender wants to see addressed.
The arbitration rule
The rule is easy to state and uncomfortable to apply: keep the lowest result, and explain the gap.
Two reasons. The first is financial: your cash flow plan has to hold on the low assumption, or you are funding a trajectory you will not survive. The second is relational: a founder who presents the most conservative of the three figures, while showing they calculated the other two, changes the conversation. It stops being about whether their number is credible, and becomes about the conditions under which they would do better.
In our case, the arbitrated figure is $100,000 for year one. It is none of the three raw results, and that is normal: it is the number from the most reliable method (capacity, $121,800), corrected downwards by what method 1 signals, and reduced by a 5 to 10 % prudence margin. The reasoning fits in three sentences in front of a lender, and every component of it is verifiable.
Three principles for arbitrating on your own project:
- Trust the method whose terms are the most verifiable. In year one, that is almost always the capacity method.
- Treat a gap wider than a factor of three as an alert, not as a choice to make. An assumption is wrong somewhere, and you need to find it before picking a number.
- Never average the three results. An average across three methods measuring three different things measures nothing at all, and it is indefensible in a meeting.
Once that number is settled, it becomes the first line of your forecast income statement, and that is when the real work starts. Our online forecasting tool takes that figure and derives the other tables from it automatically: margin, break-even point, monthly cash position and funding need.
Matching the method to your business
The capacity method remains the reference in year one, but the unit of measurement changes completely with the type of business. Here is how to adapt it.
| Business type | Recommended method | Unit of measurement | Critical assumption to document |
|---|---|---|---|
| Physical retail | Capacity | Foot traffic × walk-in rate × purchase rate × average basket | The real walk-in rate, counted on site |
| Food service | Capacity | Covers × table turnover × average ticket × opening days | The number of services actually filled |
| B2B services | Capacity | Billable days × billing rate × day rate | Non-billable time, always underestimated |
| E-commerce | Capacity + comparables | Traffic × conversion rate × average basket | The cost of acquiring the traffic, not the traffic itself |
| SaaS / subscription | Capacity | New customers per month × price × lifetime − churn | Monthly churn and sales-cycle length |
Two cross-cutting points. First, the critical assumption in the last column is the one that will carry the entire discussion with your lender or investor: source that one first, even at the expense of the rest. Second, none of these lines works without field data: a three-day foot traffic count, a conversation with two established operators, or a small-budget acquisition test beats any national statistic.
If your sector is one of the more common ones, starting from a business plan template for your industry saves you rebuilding this calculation structure: the relevant units of measurement are already laid out, and you only fill in your assumptions.
Defending your number: the three questions
Your number is settled. Now you have to defend it, and the exercise is simpler than it looks, because the questions are always the same. A lender is not assessing your optimism: they are assessing your ability to repay, and they apply specific reading criteria to your forecast to do so. Three questions come up every time.
"Where does that rate come from?" The question targets the central assumption in your calculation: the capture rate, the utilization rate, the conversion rate. A good answer cites a source, a field observation or a named comparable. A bad answer starts with "we estimated that". Write that justification down, in one sentence, next to each assumption in your table: it is the most useful document you will produce. The strongest justifications come from the field rather than from a document: the process of validating your idea before you quantify it produces a price customers actually accepted and dated commitments, two answers no sector benchmark can replace.
"What happens at minus 30 %?" This is the resilience question. It expects three quantified scenarios:
- Worst case: your chosen revenue reduced by 30 %. Its purpose is not to be likely, but to show whether your cash position holds and in which month it breaks.
- Realistic: the figure from your arbitration, reduced by the 5 to 10 % prudence margin. This is the one you present and defend.
- Best case: the upper bound. It exists less to reassure than to identify the threshold at which you will have to hire, reinvest, or turn customers away.
"What about seasonality?" This is the most discriminating question, and the one most often failed. Dividing annual revenue by twelve produces a false cash flow plan. A holiday rental, an outdoor retailer or a seaside restaurant can book half their year in three months: the annual total is identical, but the spring funding need is nothing alike. Always spread year one across months according to the real rhythm of your activity, and add the ramp-up of the start, since the first months rarely run at full speed.
These three answers are not sufficient on their own: they then have to fit into a complete financial forecast, where revenue meets costs, investments and payment terms. That is the point, and not before, at which you find out whether your project funds its own growth.
Conclusion
There is no single right method for forecasting revenue. There are three, they give different results, and that is precisely what makes them useful: the gap between them tells you something the number alone would not.
The approach comes down to four moves. Calculate from demand to know your ceiling. Calculate from capacity to know your realistic floor. Calculate from comparables to place yourself against your peers. Then keep the lowest of the three, apply a 5 to 10 % prudence margin, and keep the other two calculations to hand: they are your argument.
That number is not set in stone. Revise it every quarter through the first year: by the third quarter, you will have replaced half your assumptions with real figures. The forecast that got you open is not the forecast that will help you steer, and that is the sign it worked.
You can build this calculation, its three scenarios and the full forecast that follows from it with SeedAngels, or start from an industry template if your activity is covered. Try SeedAngels for free →
FAQ
How do you calculate a revenue forecast?
Three methods exist and cross-check each other. The demand method multiplies the size of your local market by a capture rate. The capacity method multiplies your production capacity by a utilization rate and by your price. The comparables method applies an observed industry ratio. Run all three, compare the results, then keep the most conservative one and explain the gap.
What market share should you target in year one?
In the plans we see, a new entrant rarely captures more than 1 to 3 % of the accessible local market in its first year: that is a prudence marker, not a norm, and France's public business-creation service, Bpifrance Création, uses 5 % in its reference example. But this percentage should never be the starting point of the calculation: it should be the result of your real capacity, converted back into a percentage only to check that it stays plausible.
Which method fits which type of business?
A physical store is calculated from foot traffic and average basket. A B2B service business is calculated from billable days. A restaurant is calculated from covers served and table turnover. E-commerce is calculated from traffic and conversion rate. In every case, the capacity method remains the most reliable in year one.
Do you need several scenarios?
Yes, three: worst case, realistic and best case. The realistic scenario is the one you present and defend. The worst case, usually built at minus 30 %, exists to check that your cash position holds. The best case identifies the point at which you will have to hire or reinvest. A file with no downside scenario tells a lender that the risk was never examined.
How do you factor in seasonality?
Spread your annual revenue across months rather than dividing it by twelve. Distribute it according to the real rhythm of your industry, using trade data or conversations with established operators. A restaurant, a holiday rental or an outdoor retailer can book half their year in three months, which changes the cash flow plan entirely.
How do you justify your revenue forecast to a lender?
Document three things. The origin of each assumption: where the capture rate, the price and the customer count come from. How your cash position holds if revenue drops 30 %. And the month-by-month distribution of that revenue. A lender almost never disputes a justified number: they dispute a number nobody can trace.
How many years should a revenue forecast cover?
Three years is the standard planning horizon and it is enough for the vast majority of files. Year one should be detailed month by month so that seasonality and cash tensions become visible. Years two and three can stay annual, provided the growth assumption behind them is explicitly justified.