Two slides for weeks of work
You spent weeks building your financial forecast, and now you have to reduce it to two slides. This is where most founders solve the wrong problem: they try to summarise an accounting document, when the investor is expecting something else entirely. The financials slide is not an extract from your P&L. It is a demonstration of coherence: proof that your numbers follow from your strategy, and that you know where every line comes from.
That bar has risen. The pattern is visible in the data: French startups raised €7.15bn in 2025 across 486 rounds, 26.1 % fewer deals than in 2024, more money, fewer deals. The numbers get scrutinised earlier and more seriously than they did three years ago. A financials slide that survived a 2021 meeting will not survive today's.
This guide treats the financials slide as what it really is: an exercise in compression. Which lines to keep, which to send to the appendix, what horizon to use, and which assumptions to display so the whole thing holds together the day an analyst opens your full forecast.
What investors actually look for in your numbers
Let's clear up one misunderstanding first: nobody believes your year-three revenue figure. The investor reading your financials slide is not trying to verify an accuracy that does not exist. They are trying to work out whether you are someone who can be trusted with money.
In practice, they test three things. Coherence first: do your numbers follow from your assumptions, or were they reverse-engineered to reach a flattering result? If revenue multiplies by ten while headcount in sales stays flat, the slide contradicts itself. Calibrated ambition next: too timid and you are not presenting a venture case; too wild and you signal that you have never tested your assumptions against reality. And finally command of the model: in a ten- to fifteen-minute meeting, one question is enough to reveal whether you understand your own business or are reciting a spreadsheet someone else built.
These three tests are about the future, but they rest on what you have already demonstrated: the financials slide is validated or disqualified by your traction metrics, the only real anchor point for your curve. A 15 % monthly growth projection does not carry the same weight depending on whether you show three months of history at that rate, or none.
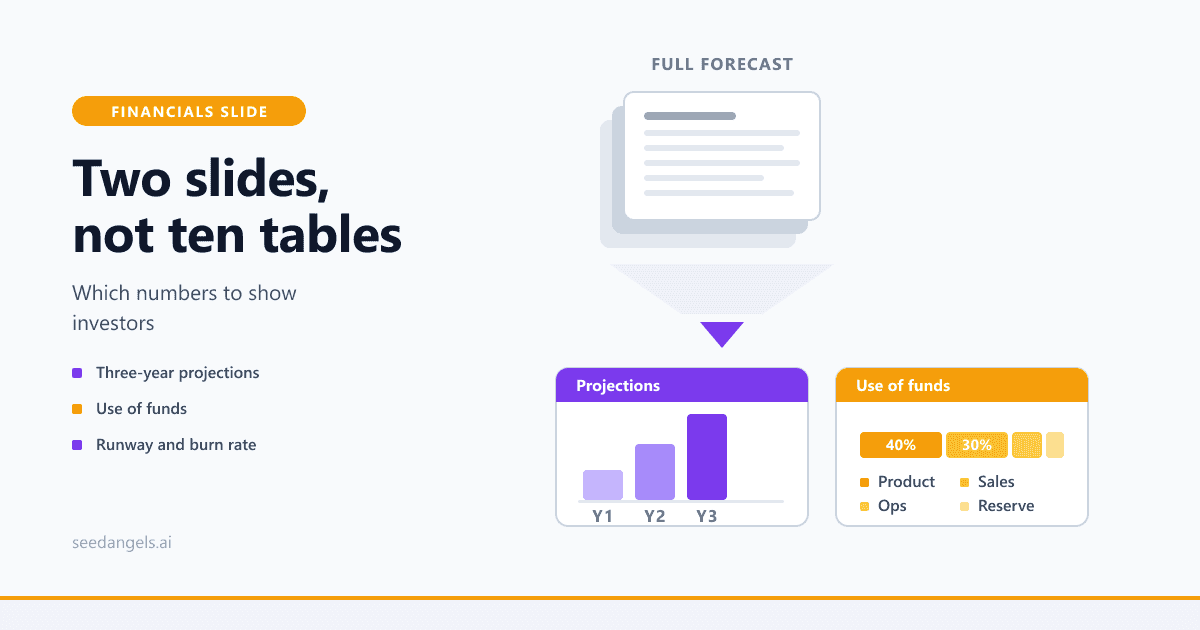
The two financial slides you need
A deck does not need a financial section. It needs two slides: the projections, and the use of funds. Everything else (balance sheet, monthly cash flow, cost breakdowns) belongs in the appendix. This economy is not laziness, it is a format constraint: these two slides sit inside a document that runs ten to fifteen slides in total, and our guide to the complete pitch deck structure covers where each one sits in the narrative.
Slide 1: the projections
This is the slide you will most want to overload. Resist: an investor who has to hunt for information does not find it. Your projection fits in six lines maximum and three columns (year 1, year 2, year 3).
| Line to show | Why it is there |
|---|---|
| Revenue | The trajectory, the one number everyone will read |
| Gross margin (% and value) | The quality of the revenue: revenue at 20 % margin is nothing like revenue at 85 % |
| Aggregated costs in 2 or 3 items (payroll, marketing, other) | The cost structure and how it evolves |
| Operating result (EBITDA) | The tipping point toward profitability |
| Headcount (FTE at year end) | The link between ambition and hiring |
| Exit MRR or ARR (recurring models) | Recurrence, the only line a SaaS fund truly cares about |
Two terms worth fixing if you are not comfortable with them: gross margin is what remains of revenue once you deduct the costs directly tied to delivering what you sold (hosting, licences, subcontracting, goods purchased). EBITDA, or operating result before depreciation and amortisation, measures what the business itself generates, before financing and investment decisions.
What you do not put on this slide: the projected balance sheet, the month-by-month cash flow plan, line-by-line external costs, depreciation schedules, and any per-product analytical breakdown. Those exist, and they are expected, but in the appendix or the data room, not in the body of the deck.
How many years? Three, in the vast majority of cases. The SBA's business plan guidance asks for a five-year outlook in a full written plan, but a deck slide is not a plan: three columns are as far as an early-stage investor can meaningfully read. Five years is only justified for long-cycle models: deeptech, hardware, health, infrastructure. Beyond that you are not adding vision, you are adding fiction, and handing your counterpart three extra columns to challenge.
One point of form: prefer a readable table to a chart. A curve looks good but hides the values, whereas a table lets the investor run their own division, which they will do anyway.
Slide 2: the use of funds
The use of funds slide is the one most often rushed, even though it is the most directly actionable. It answers a single question: what does this money actually unlock?
The construction rule: four to six line items maximum, expressed as a percentage and in currency.
- Product and engineering: development, infrastructure, R&D
- Sales and marketing: acquisition, sales force, awareness
- Hiring, if you have not already split it across the two items above
- Operations and overhead: offices, tooling, admin, legal
- Reserve of 10 to 15 %, which signals that you know no plan ever unfolds as written
Here is what a breakdown looks like on an $800,000 round:
| Item | % | Amount | What it funds |
|---|---|---|---|
| Product and engineering | 40 % | $320,000 | 3 developers + infrastructure |
| Sales and marketing | 30 % | $240,000 | 2 sales hires + acquisition budget |
| Operations and overhead | 15 % | $120,000 | Tooling, legal, admin |
| Reserve | 15 % | $120,000 | Room to manoeuvre over 18 months |
| Total | 100 % | $800,000 | 18 months of runway |
These percentages are observed distributions, not a standard: a deeptech company in R&D will push product to 60 %, a SaaS company scaling will tip toward sales. What is not negotiable is the link to milestones. Every line must translate into a dated outcome: "this $240,000 takes us to 40 paying customers and $35k MRR within 18 months." A use of funds with no milestones is a shopping list.
The amount itself follows a simple rule: it should cover 18 to 24 months of runway and fund the milestones expected at the next stage: no more (you dilute yourself for nothing), no less (you will be permanently fundraising). That calibration changes entirely with the stage you are targeting, and it is probably the most expensive mistake in a first deck: our dedicated guide explains how to calibrate the amount you ask for by stage, with the ranges observed in the market. As a reference point on early-stage rounds, Carta reported in 2025 that median post-money SAFE valuation caps sat around $10 million for rounds between $250,000 and $1 million.
One last point founders often skip: the amount you ask for mechanically determines how much of the company you give up. Before locking a figure, measure your dilution on this round and the next, because a founder who walks into a meeting owning that consequence negotiates from a different position.
Runway and burn rate: the numbers you will be asked for
This is the calculation the investor runs before looking at your year-three revenue, for a simple reason: your three-year revenue is a projection, whereas your runway is computed from figures already on the record, the cash in your account today and your burn over the last three months. One extrapolates; the other has yet to be proven.
Net burn rate is the cash actually consumed each month, your cash out minus your cash in. Not to be confused with gross burn, which counts spending only: as soon as you have revenue, only net burn matters.
Runway is the number of months your cash lets you operate at that rate:
Runway (in months) = Available cash ÷ Monthly net burn rate
A full example. You have $600,000 in the bank. Your monthly cash out is $75,000 (salaries, payroll charges, tooling, marketing) and you collect $25,000 in revenue. Your net burn is therefore 75,000 − 25,000 = $50,000 per month, and your runway is 600,000 ÷ 50,000 = 12 months. Investopedia's definition uses the same arithmetic, and notes that understanding net burn alongside runway is essential to keeping a company solvent long enough to reach its next milestone.
That single number says more than your entire projections slide: it gives the date you run out of money, and therefore the date by which you must have raised again. And a round takes months to close. A 12-month runway means, in practice, roughly six months of execution before you are back out fundraising.
So display three numbers, on your projections slide or in a footnote: your current cash, your monthly net burn, and how many months the round gives you: that is, (current cash + amount raised) ÷ the net burn you expect after the round. Watch that last term: hiring pushes burn up, so do not divide by today's figure. Taking the example above, $600,000 in the bank plus $800,000 raised, with burn rising to $90,000 a month once the hires are made, gives roughly 15 months. You answer the question before it is asked.
One classic trap to finish: a net burn that stays flat across three years while you are hiring. If headcount goes from 5 to 20, burn has to follow, and that inconsistency is spotted instantly.
Assumptions: the part founders forget to display
A projections table with no assumptions is an opinion. The same table with three visible assumptions becomes a line of reasoning, and reasoning can be discussed, adjusted, defended. That is exactly what the investor wants to do with you.
So display three to five key assumptions, on the slide itself or in a footnote:
- Average price per customer or per contract
- Sales cycle, in weeks between first contact and signature
- Conversion rate at the key stages of your funnel
- CAC (customer acquisition cost), even if estimated
- Sales hiring pace, which drives everything else
These assumptions get their credibility from where they come from, and this is where the most important distinction on your whole financials slide plays out.
Bottom-up or top-down? A bottom-up projection starts from the real mechanics of your business: customers acquired per month, multiplied by average deal size. A top-down projection starts from market size and claims a percentage of it. Investors distrust top-down, which commits to nothing and demonstrates no operational understanding.
The famous "we're targeting 1 % of a $10 billion market" is the most universally recognised warning sign in the ecosystem. Not because the number is wrong, but because it says nothing: there is no action plan behind "1 %". The bottom-up version of the same ambition ("12 sales reps, 4 signatures each per month, average deal size $18,000") can be attacked line by line, and that is precisely what makes it credible. This does not invalidate market sizing, which remains essential elsewhere in the deck: your bottom-up should in fact reconcile with the market size you claim: if your three-year projection exceeds the addressable market you announced a few slides earlier, one of the two numbers is wrong.
What to show when you have no revenue yet
This is where most early-stage founders sit, and it blocks them more than it should. Nobody expects history from you. What is expected is that you replace it with something else that can be verified.
Show the mechanics of the model rather than a curve. A trajectory starting from zero teaches nobody anything. The triptych intended price × target volume × estimated acquisition cost, on the other hand, shows you have thought about how money will come in. It is the mechanism that gets judged, not the result.
Document every assumption with a source. Prices charged by comparable players, sector conversion rates, quantified findings from your customer interviews, costs observed in your first acquisition tests. A sourced assumption is a debatable assumption; an unsourced one is a rejected assumption.
Show the cost of proof. This is often the most convincing number in a pre-revenue deck: how much it costs, and how long it takes, to reach the first paying customer, then the first ten. You demonstrate that you know what you are buying with the money you are asking for.
Own the uncertainty with a range. Three scenarios (low, base, high) on the same line beat a single, falsely precise figure. A founder who says "between $400k and $900k of revenue in year 2 depending on acquisition pace" is more credible than one who says $687,340. The second signals someone who read their spreadsheet without ever questioning it.
The 5 mistakes that discredit a financials slide
These five mistakes are not about how you build your financial statements, but about how you present them in the deck. They are common, visible within seconds, and all avoidable.
-
The hockey stick with no assumption behind it. A flat line for eighteen months then a vertical explosion: everyone has seen that curve hundreds of times. The problem is not the growth claimed, it is the absence of an identifiable event that triggers it. If the take-off depends on a specific hire or a dated product release, say so. Otherwise the curve reads as a wish.
-
Top-down revenue. "1 % of a $10 billion market" remains the single most disqualifying sentence in a pitch deck. It describes no acquisition mechanism, assumes no effort, and could be written by anyone who knows nothing about your business. Replace it systematically with the corresponding bottom-up calculation, even if the result is ten times more modest.
-
Fixed costs that never move. Your revenue multiplies by ten over three years, but payroll grows by 15 % and infrastructure costs stay flat. This is the easiest inconsistency for an analyst to catch: they divide two lines, and the case is closed. Strong growth always comes with cost growth, even if less than proportional.
-
An amount raised that is disconnected from the spending plan. You ask for $1.5M, your use of funds details $900,000, and your projected burn consumes all of it in nine months. Those three numbers have to reconcile exactly and tell the same story: amount requested = sum of line items = stated runway × average net burn.
-
Deck numbers that differ from the forecast sent afterwards. This is the most expensive mistake, because it lands at the worst moment: when the investor is already interested. A gap between the two documents never reads as an update, it reads as a lack of rigour. This kind of flaw sits alongside the forecasting mistakes that sink a funding file and costs far more than a bad number: it costs trust.
From slide to full forecast: what comes next in due diligence
The financials slide concludes nothing. If it works, it triggers a request for the complete file. That is where the real assessment happens, over weeks of back-and-forth with an analyst who will rebuild your model in their own spreadsheet.
The documents expected at that point go well beyond your two slides. The SBA's business plan guidance sets the baseline for the financial section (income statements, balance sheets, cash flow statements and capital expenditure budgets), and an equity investor will expect the forward-looking version of each:
- The projected income statement: how the result forms over three financial years.
- The cash flow plan, monthly for the first year: the table where the tensions your P&L hides finally show up.
- The projected balance sheet: assets, liabilities and how the round changes both.
- The capital expenditure budget: what you buy, when, and out of which resources.
- The break-even point: the level of activity at which you cover your costs.
The link between these statements and your slide must be direct: the revenue on your slide is the revenue in the income statement, the burn on your slide comes out of the cash flow plan, the amount requested comes out of the financing plan. If you have to "find" those correspondences when the request arrives, the slide was built backwards. Our guide to building a complete financial forecast covers how each statement is produced. This article only covers how they are staged.
One important nuance if you have already put together a bank file: the expectations are not the same. A lender assesses your ability to repay and looks first at cash and debt ratios; an equity investor assesses growth potential and looks first at trajectory and market. A forecast built for a loan does not get presented as-is to a fund.
This is exactly the work our forecasting tool automates: generating the full set of forecast statements from your project assumptions, with an AI deliberately kept away from your revenue assumptions, so that the deck slide and the due diligence file come out of the same model.
Financials slide examples
In our free pitch deck examples, the financials slide follows the rules of this article: a headline that states the conclusion, a 3-year table and the key metrics above it. For a SaaS startup:
The cash slide right after it shows what the round pays for:
For a labour-heavy business like a hotel, the same structure shows where the margin comes from, with ancillary revenue in the mix:
FAQ
How many years of projections should you present?
Three years is enough in the vast majority of cases: three years is what a deck slide can support, even though a full written plan such as the SBA's asks for a five-year outlook. Five years is only justified for long-cycle models: deeptech, hardware, health, infrastructure. Beyond that, the numbers lose all demonstrative value and expose the founder for no reason.
Should you put a projected balance sheet in the pitch deck?
No. The projected balance sheet and the monthly cash flow plan belong in the appendix or the data room, not on the slide. The deck shows the trajectory only: revenue, margin, main cost lines, operating result. Detailed accounting documents will be requested during due diligence, and they must match the deck exactly.
How do you calculate your runway?
Runway is calculated by dividing available cash by monthly net burn rate, meaning the cash actually consumed each month. With $600,000 in the bank and $50,000 consumed per month, runway is twelve months. Investors generally expect a round to fund 18 to 24 months of operations, below that, you are back fundraising before hitting the milestone that justifies it.
How do you present the use of funds?
Break the amount raised into four to six line items at most: product and engineering, sales and marketing, hiring, operations, and a reserve. Express each item as a percentage and in currency, then tie them to dated milestones. A credible use of funds answers one question: what does this money actually unlock?
What is the difference between bottom-up and top-down assumptions?
A bottom-up projection starts from the real mechanics of your business: customers acquired, average price, conversion rate. A top-down projection starts from market size and claims a percentage of it. Investors distrust top-down, which commits to nothing and demonstrates no operational understanding.
What should you show if you have no revenue yet?
Show the mechanics of the revenue model rather than a curve: intended price, estimated acquisition cost, conversion assumptions, and the budget needed to reach the first customer. Present a range rather than a single figure, and document every assumption. Acknowledged uncertainty lands better than false precision.
Do the deck numbers have to match the business plan?
Yes, to the last dollar. A gap between the deck's numbers and the forecast sent afterwards is one of the most common triggers of distrust in due diligence. If you update your projections, update the deck at the same time, and keep a single reference version.
Conclusion
Compressing a financial forecast into two slides is not an exercise in summarising, it is an exercise in prioritising. You are not trying to show everything you calculated, but to show that your numbers hold together: a three-year trajectory, a cost structure that tracks growth, an amount requested that buys a runway and identifiable milestones, and three to five assumptions owned in writing.
Run the test before your next meeting. Take your two slides and ask yourself the investor's three questions: where does each line come from, what happens if the central assumption degrades by 30 %, and how many months does the amount requested buy you? If you can answer without reopening your spreadsheet, your slides are ready. If not, the problem is not your layout, it is that the forecast behind them is not yet yours.
You can also have your pitch deck analysed for free, to check slide by slide what an investor will read into it. Try SeedAngels for free →