The slide investors read first
The traction slide is one of the first an investor scrutinises, and it is also the one most founders build backwards. They pile on every flattering number they have, hoping that sheer volume makes an impression. It does the opposite: the more metrics you show, the more clearly you signal that you do not know which one matters.
A traction slide is not there to prove that "it's working." It is there to prove that growth is repeatable: that whatever produced your last customers will produce the next ones. This article gives you the KPIs to keep for your business model, benchmarks to place your own numbers against, and the list of metrics that undermine you in a second.
What traction means to an investor
Traction is measurable proof that the market is responding to your offer: revenue, active users, retention, pre-orders or signed contracts. It differs from stated interest: a prospect who says "this is interesting" is not traction. Only what an investor can verify in your tracking tools counts.
That boundary is sharper than it looks. A customer who has signed a quote is traction. A customer who has requested a demo is not. A waiting list where people left an email in exchange for free content is not either, unless you can show that a meaningful share of that list went on to pay.
The test to apply is simple: does the metric describe behaviour that was costly for the person who produced it? Paying, committing contractually, coming back every week, spending time on an onboarding: those are costly behaviours. Clicking, signing up, downloading, following an account: those are free, and therefore uninformative.
The golden rule: trajectory beats level
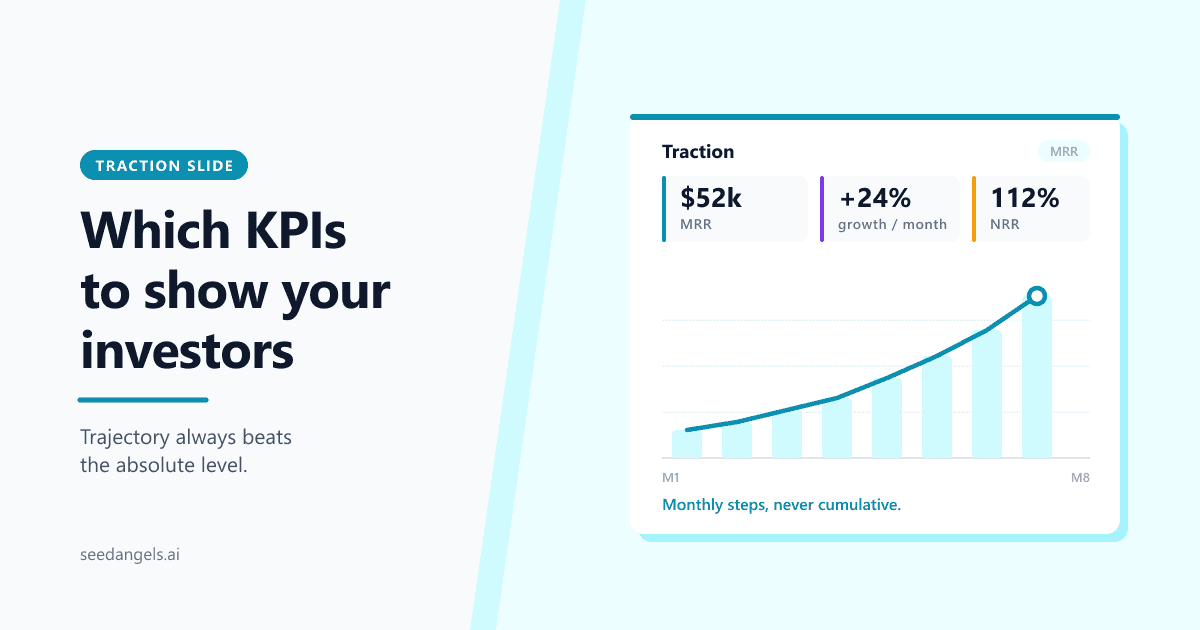
A founder showing $50k in MRR (Monthly Recurring Revenue) growing 25 percent per month is more interesting to a seed fund than a founder at $200k MRR that has been flat for a year. The first shows a machine that is accelerating; the second shows a company that has found its ceiling. What the investor is buying is not the snapshot: it is the slope.
The reason is arithmetic. Monthly growth compounds: 15 percent a month over twelve months multiplies revenue by 5.4. A seed investor is not funding your current revenue, they are funding its projection three to five years out, and that projection depends almost entirely on the growth rate, very little on the starting point. This is also why what investors actually look at has less to do with the absolute value of your indicators than with how they move over time.
That emphasis on slope is not a stylistic preference. The VC firm CRV notes that seed investors typically want to see at least three out of four pillars: team, product, market and traction looking solid, and that by Series A, validation must have translated into repeatable traction, with net revenue retention above 100 percent and credible unit economics. Traction is the pillar that carries the story from one round to the next.
One caveat, though: the slope is only worth something if the market can absorb it. Growth of 30 percent a month in an addressable market of $5 million stops mechanically within a few quarters, and the investor runs that calculation before you do. This is where you need to be able to size your market with a defensible method, otherwise your curve tells a story your market cannot support.
Which KPIs for your business model
There is no universal list of pitch deck KPIs. A good traction slide shows two to three primary indicators, chosen according to your business model, and relegates the rest to the appendix. Here is the mapping to apply.
| Model | Primary KPIs | Secondary KPIs | Classic trap |
|---|---|---|---|
| B2B SaaS | MRR/ARR, monthly growth, net revenue retention (NRR) | Logo churn, CAC payback, gross margin | Strong growth masking high churn |
| Marketplace | GMV, take rate, repeat purchase rate | Liquidity, supply/demand ratio, time to match | Showing GMV as though it were revenue |
| E-commerce / DTC | Revenue, average order value, repeat purchase rate | Contribution margin, CAC, return rate | Growth bought with ad spend, with no margin |
| Consumer app | DAU/MAU, D1/D7/D30 retention | Virality (K-factor), session time, ARPU | Presenting downloads as users |
| Deeptech / Hardware | Validated technical milestones, letters of intent, pre-orders | Industrial partnerships, filed patents, technology readiness level | A milestone announced with no validation criterion |
Every model has its own mode of unintentional cheating. The five sections below detail the one that is waiting for you.
B2B SaaS: the hidden churn trap
In SaaS, strong acquisition can conceal mediocre retention for a very long time: as long as you sign more new customers than you lose, MRR climbs. The investor separates the two flows systematically. The metric that settles it is net revenue retention (NRR): the revenue generated today by the customers you acquired twelve months ago, expansion included, relative to what they were paying then.
An NRR above 100 percent means your existing customer base grows on its own, without acquisition. It is the strongest signal a SaaS traction slide can carry, and the one founders most often leave out, in favour of a raw MRR curve. Presenting that NRR assumes you modelled it first: the monthly MRR waterfall (new, expansion, contraction, churn) that produces it is built in the SaaS startup business plan.
Marketplace: the gross GMV trap
GMV (Gross Merchandise Value) is the total volume transacted on your platform. It is not your revenue: yours is GMV multiplied by your take rate, the commission you charge. Showing "$4M in GMV" without mentioning a 3 percent take rate lets people believe you are doing $4M when you are doing $120k, and an investor who discovers the gap on their own loses trust for the rest of the deck.
The second indicator that counts is liquidity: the share of listings that find a buyer within a given window. An illiquid marketplace, however many sign-ups it has on both sides, does not yet have a market. That is also why the marketplace ranks among the most frequently trapped startup ideas: bootstrapping both sides at once costs far more than the concept suggests.
E-commerce: the unprofitable growth trap
In e-commerce, it is always possible to buy growth: you simply increase the ad budget. So the traction slide has to demonstrate that growth survives the advertising. The two indicators that prove it are contribution margin (what is left after product cost, logistics and acquisition cost) and the repeat purchase rate at 6 or 12 months.
A CAC (Customer Acquisition Cost) presented on its own means nothing; it only becomes readable against LTV (Lifetime Value, the cumulative margin a customer generates over their lifetime). An LTV/CAC ratio below 3 on an e-commerce model generally means you are funding your growth at a loss.
Consumer app: the downloads trap
A download measures one thing: your ability to get someone to click in an app store. An app's traction is read in the D1 / D7 / D30 retention curves, the share of users who come back the next day, a week later, a month later. A consumer-focused investor looks at D30 first, because that is where habit becomes visible.
The DAU/MAU ratio (daily active users over monthly active users) completes the picture: it measures usage intensity. But you still have to define "active" explicitly on the slide, because a vague definition is as good as no metric at all.
Deeptech and hardware: the vague milestone trap
Without revenue, your traction is made of milestones. The trap is phrasing them in unverifiable terms: "working prototype," "technical validation underway," "advanced discussions with an industrial partner." Every milestone should carry a validation criterion, a date and a third party: "82 percent efficiency measured in an independent lab in March 2026" is worth a hundred times "performance in line with expectations."
Letters of intent and pre-orders play the role of revenue here: they prove that a professional buyer committed their signature before the product even existed.
Benchmarks: are your numbers any good
This is the question every founder asks without daring to phrase it. Here are published reference points, with their sources, and a precaution that applies to everything that follows.
⚠️ These benchmarks are largely US-centric and SaaS-focused. They give an order of magnitude, not a universal standard. A B2B SaaS sold at $40k a year to large accounts and an app at $5 a month do not obey the same retention laws. Use them to place your numbers, never to justify them.
| Indicator | Published benchmark | Source |
|---|---|---|
| Monthly logo churn (below $1M ARR) | 3 to 5 percent, roughly 30 to 46 percent a year | CRV, 2026 |
| Annual revenue churn ($1–10M ARR) | Median 12.5 percent; top quartile below 5.48 percent | CRV, 2026 |
| Median NRR ($1–5M ARR) | Around 104 percent | CRV, 2026 |
| NRR expected at Series A | 100 percent = baseline, 110–120 percent = competitive, above 120 percent = premium | CRV, 2026 |
| Customer retention of the best SaaS companies | Around 85 percent (15 percent annual churn) | ChartMogul, SaaS Benchmarks Report 2023 |
| Monthly MRR growth at seed | 15 to 20 percent a month commonly cited | Market rule of thumb, highly variable |
Two readings are worth keeping. First, the VC firm CRV explicitly classifies the NRR thresholds expected at Series A as 100 percent for the baseline, 110 to 120 percent for a competitive profile and above 120 percent for a premium one, and notes that most early-stage companies fall short of the 100 percent baseline. So if your NRR is at 98 percent, you are not out of the game: you are at the median, and your trajectory is what will make the difference.
Second, ChartMogul data relayed by Skalin, drawn from more than 2,100 SaaS companies, puts the customer retention of the best performers at around 85 percent and shows that the share of ARR coming from expansion rose from 28.8 percent in 2020 to 32.3 percent. Above all: companies with best-in-class retention grew 1.8 times faster than their peers. Retention is not a defensive metric, it is a growth engine, and that is exactly the argument to make on your slide.
These observed metrics only stay credible if they connect to what you project. An investor who sees 20 percent monthly growth on the traction slide and 8 percent in the forecast understands that one of the two numbers is decorative: it is the consistency between the two that gets judged, and a financial forecast has to start from your actual traction, not from a round target. A tool like SeedAngels builds the forecast precisely from your acquisition and retention assumptions, which makes that consistency verifiable line by line.
Vanity metrics: the numbers that undermine you
A vanity metric is a flattering number with no link to the economic health of the business. Investors spot them instantly, and draw an unfavourable conclusion: if you are showing that one, the real one must be bad. Here are the most frequent ones and their credible replacements.
- Follower count → conversion rate from audience to paying customers, or the share of revenue attributable to the social channel.
- Newsletter sign-ups → number of subscribers who made a first purchase, and the median time from sign-up to purchase.
- Raw downloads → D30 active users and the retention curve by cohort.
- "Users" with no definition → an explicit definition of an active user, shown on the slide, then the matching number.
- Cumulative revenue shown as a curve → monthly revenue, month by month.
- Funding rounds already raised → what those rounds produced: milestones hit, revenue generated, team hired.
- Number of partnerships signed → the business volume or users those partnerships actually delivered.
- Press mentions → qualified traffic or customers acquired through those mentions.
What these replacements have in common: they turn a surface number into a consequence number. An investor does not hold 40,000 followers against you; they hold it against you when you present them as proof of a market. That confusion between visibility and traction is one of the mistakes that undermine a deck fastest, because it can be spotted without asking a single question.
The beautiful curve trap
A curve that climbs nicely is not necessarily good news, and experienced investors have a checklist of verification reflexes. Here is what triggers their suspicion:
- A Y axis with no unit. A curve that climbs without telling you whether it measures dollars, users or sign-ups is a decorative graphic.
- Cumulative figures presented as growth. A cumulative revenue curve always climbs, even when the business is collapsing: it is mathematically impossible for it to fall.
- A period chosen to hide a plateau. Showing the last four months when you have three years of history is never a neutral choice.
- A truncated scale. An axis starting at 90 percent turns a 2-point variation into a cliff.
- No start date. Without a dated point of origin, no growth rate can be computed, and that is precisely the calculation the investor wants to make.
- Undisclosed smoothing or a rolling average. Smoothing erases seasonality and accidents, which is to say the information.
The rule fits in one sentence: an honest chart shows its unit, the full period since launch, and a monthly, non-cumulative step. If your curve is less impressive that way, the impression came from the presentation, and the investor was going to notice regardless, at a far higher cost in trust.
What to show when you have no traction yet
The absence of revenue is not disqualifying at pre-seed, provided you replace it with substitutable proof that is dated and quantified. The acceptable proxies:
- Signed letters of intent, with the signatory's name, the date, and where possible a volume or an amount.
- Pre-orders or deposits: a financial commitment, even partial, is worth a thousand declarations of interest.
- A qualified waiting list, useful only if you show a qualification criterion (sector, size, stated budget) and a conversion rate on a first sample.
- Quantified customer interview results: "34 interviews, 27 confirm the problem, 12 report an existing budget," backed by two or three verbatim quotes.
- An MVP with real usage: even with 40 users, a D30 retention curve on a live product is worth more than a polished mockup.
- A distribution partnership, signed, with the channel and the reachable audience volume.
- Validated technical milestones, with a criterion, a date and a third-party validator.
⚠️ What does not count as traction: unqualified sign-ups, "strong interest" with no written trace, an unsigned letter of intent, a partnership "in discussion," press coverage, or the number of people who told you the idea was good.
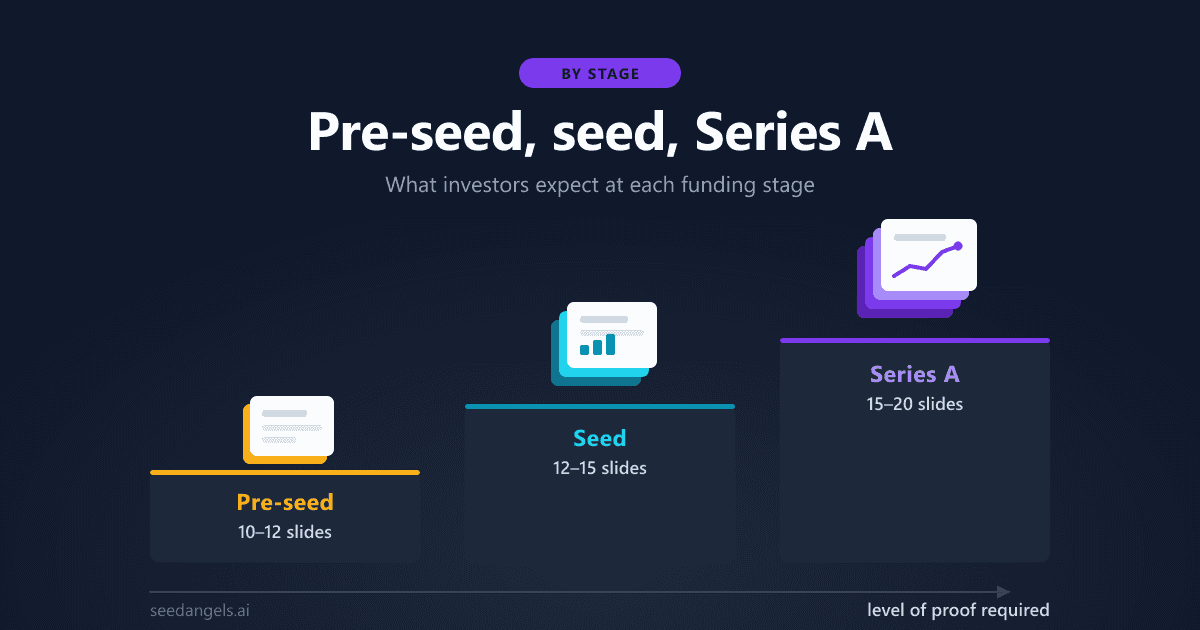
This tolerance for proxies is specific to pre-seed: from seed onwards, investors expect observed numbers, and the bar rises another notch after that. That shift is exactly what investor expectations by stage sets out, and it should determine the content of your slide long before your aesthetic preferences do.
Where the traction slide belongs in the deck
As soon as it exists, traction moves up. At seed and beyond, it should appear within the first five slides, right after the problem and the solution, sometimes even before the solution when the numbers are spectacular.
The justification is mechanical: a first deck is read in a few minutes, often less. CRV notes that a seed deck should be 10 to 15 slides with a clear one-line description, a problem that resonates, a product with concrete benefits, and whatever early traction you can point to. Within that budget, putting your strongest proof on slide 12 is betting that the reader will get that far.
At pre-seed with no traction, the logic inverts: the proxies go after the solution and the team, because they only make sense once the product has been laid out. For the rest of the sequence, the full structure of a pitch deck gives the reference order into which this slide fits.
To see where a traction slide fits in a complete deck, right after the solution, browse our free pitch deck examples: one startup in six designs, as PDF and PowerPoint.
FAQ
What is traction for a startup?
Traction is measurable proof that the market is responding to your offer: revenue, active users, retention, pre-orders or signed contracts. It differs from stated interest: a prospect who says "this is interesting" is not traction. Only what an investor can verify in your tracking tools counts.
Which KPIs belong in a pitch deck?
Two to three primary KPIs, chosen according to your business model: MRR, monthly growth and net revenue retention for SaaS; GMV, take rate and repeat purchase rate for a marketplace; average order value, contribution margin and repeat purchase rate for e-commerce. Beyond three main metrics, the message dilutes.
What is a vanity metric?
A vanity metric is a flattering number with no link to the economic health of the business: followers, raw downloads, newsletter sign-ups, or cumulative revenue presented as a growth curve. Investors spot them instantly and conclude that you are hiding the real metrics.
What monthly growth rate is considered good?
For an early-stage startup, 15 to 20 percent monthly recurring revenue growth is a commonly cited reference point, with higher spikes on small bases. Be careful: these orders of magnitude come from studies that are largely US-centric and SaaS-focused. Consistency of the slope matters more than the peak.
What is a good SaaS churn rate?
Below one million dollars in ARR, monthly logo churn of 3 to 5 percent (roughly 30 to 46 percent a year) remains common according to the VC firm CRV. It should drop sharply afterwards. On the revenue side, net revenue retention (NRR) of 100 percent is the expected baseline at Series A, with 110 to 120 percent considered competitive.
What should I show if I have no traction yet?
Replace it with substitutable, verifiable proof: signed letters of intent, pre-orders, a qualified waiting list, quantified customer interview results, an MVP with real usage, or a distribution partnership. At pre-seed, investors accept this, provided these elements are dated and quantified rather than declarative.
Where should the traction slide go in a pitch deck?
As soon as it exists, place it high: ideally among the first five slides, right after the problem and the solution. An investor spends very little time on a first deck; burying traction on slide 12 is betting that they will read that far.
Conclusion
A good traction slide is not the one showing the biggest numbers: it is the one showing the two or three numbers that actually describe your business model, over a complete period, with a readable slope. Everything else (followers, downloads, cumulative totals, partnerships in discussion) works against you, because an investor concludes that you are compensating.
Run the exercise before your next meeting: remove from your slide every metric that does not measure costly behaviour, keep three at most, show the unit and the full period, and check that your curve is monthly rather than cumulative. If what remains looks thin to you, you have just discovered what the investor was going to see anyway, with the advantage of still having time to work on it.
SeedAngels generates your business plan, financial forecast and pitch deck from your project data, keeping your revenue assumptions under your control. Try SeedAngels for free →
You can also have your pitch deck analysed for free to find out, slide by slide, whether your traction is presented in the right place and with the right metrics.