The forecast that disqualifies itself in one slide
A SaaS business plan that projects revenue in a straight line disqualifies itself before the slide is over. The investor is not reading the number: they are reading the shape of the curve. A straight line tells them you multiplied a customer count by a price and never modelled the one thing that defines your business: whether your customers stay, or leave.
The cause is structural. In a conventional business, a month's revenue is the sum of that month's sales: a flow. In SaaS, it is a stock inherited from the previous month, which you grow and which erodes. Until your forecast represents that stock, it does not describe your company.
This article gives you the full mechanism: the month-by-month MRR waterfall with a reproducible worked table, the compounding effect of churn over 36 months, the 2026 market thresholds with their sources, and the path from MRR to P&L, cash flow and runway.
Why a SaaS business plan is not modelled like any other
In a subscription model, a month's revenue is not a sale: it is the previous month's revenue, increased by new subscriptions and upgrades, reduced by cancellations and downgrades. Revenue becomes a stock you move, not a flow you add up.
That difference has one immediate and underestimated consequence: churn compounds. Losing 3% of your base every month does not cost 3% over the year but 30.6%, because the loss applies each time to an already smaller base. No other variable in your model has that cumulative effect. This is why a SaaS startup business plan template has to be built around a monthly waterfall, where a generic template settles for an annual sales table.
The sector itself justifies the rigour. Eurostat's preliminary structural business statistics put the EU services sector at €12.6 trillion in turnover across 21.2 million enterprises in 2024, 63.4% of all enterprises and 52.7% of business economy employment. Software sits inside one of the most crowded categories in the economy, which means your model has to explain retention, not just demand.
The MRR waterfall: the only right way to forecast
The MRR waterfall breaks the evolution of monthly recurring revenue into four distinct movements. It replaces a revenue projection with a stock model, and it is the only structure a SaaS investor treats as serious.
The formula
Ending MRR = Starting MRR
           + New          (new customers)
           + Expansion    (upgrades, added seats)
           − Churn        (lost customers)
           − Contraction  (downgrades, removed seats)
The four movements are managed separately because they respond to different levers: New depends on marketing and sales, Expansion on product and customer success, Churn on perceived value, Contraction on pricing. Collapsing them into a single "growth" line hides which of the four is broken.
The four assumptions to set
Your entire revenue forecast rests on four numbers. Each has to stand on its own, with a source or a field observation behind it:
- New customers per month, and above all its progression. This is your acquisition capacity, constrained by your marketing budget and the size of your sales team. A gentle, argued ramp beats an unexplained take-off in month 7.
- Average monthly ticket (ARPA, Average Revenue Per Account). If you have several plans, weight them by their real share of your observed mix, not the share you are hoping for.
- Monthly churn rate, expressed in lost revenue rather than lost logos. The two diverge as soon as your customers do not all pay the same ticket, and it is revenue churn that drives your MRR.
- Monthly expansion rate, the additional MRR generated by customers you already have. It is the assumption most often skipped, and the one that decides your net revenue retention.
The 12-month waterfall, with numbers
Here is a complete waterfall for an early-stage B2B SaaS. Assumptions: €250/month average ticket, 2% monthly churn, 1% monthly expansion, acquisition ramping from 6 to 20 new customers per month.
| Month | Starting MRR | + New | + Expansion | − Churn | Ending MRR | Customers |
|---|---|---|---|---|---|---|
| M1 | €0 | €1,500 | €0 | €0 | €1,500 | 6 |
| M2 | €1,500 | €1,750 | €15 | €30 | €3,235 | 13 |
| M3 | €3,235 | €2,000 | €32 | €65 | €5,203 | 21 |
| M4 | €5,203 | €2,250 | €52 | €104 | €7,401 | 29 |
| M5 | €7,401 | €2,500 | €74 | €148 | €9,827 | 39 |
| M6 | €9,827 | €2,750 | €98 | €197 | €12,478 | 49 |
| M7 | €12,478 | €3,000 | €125 | €250 | €15,354 | 60 |
| M8 | €15,354 | €3,250 | €154 | €307 | €18,450 | 72 |
| M9 | €18,450 | €3,750 | €185 | €369 | €22,016 | 85 |
| M10 | €22,016 | €4,000 | €220 | €440 | €25,795 | 100 |
| M11 | €25,795 | €4,500 | €258 | €516 | €30,037 | 116 |
| M12 | €30,037 | €5,000 | €300 | €601 | €34,737 | 133 |
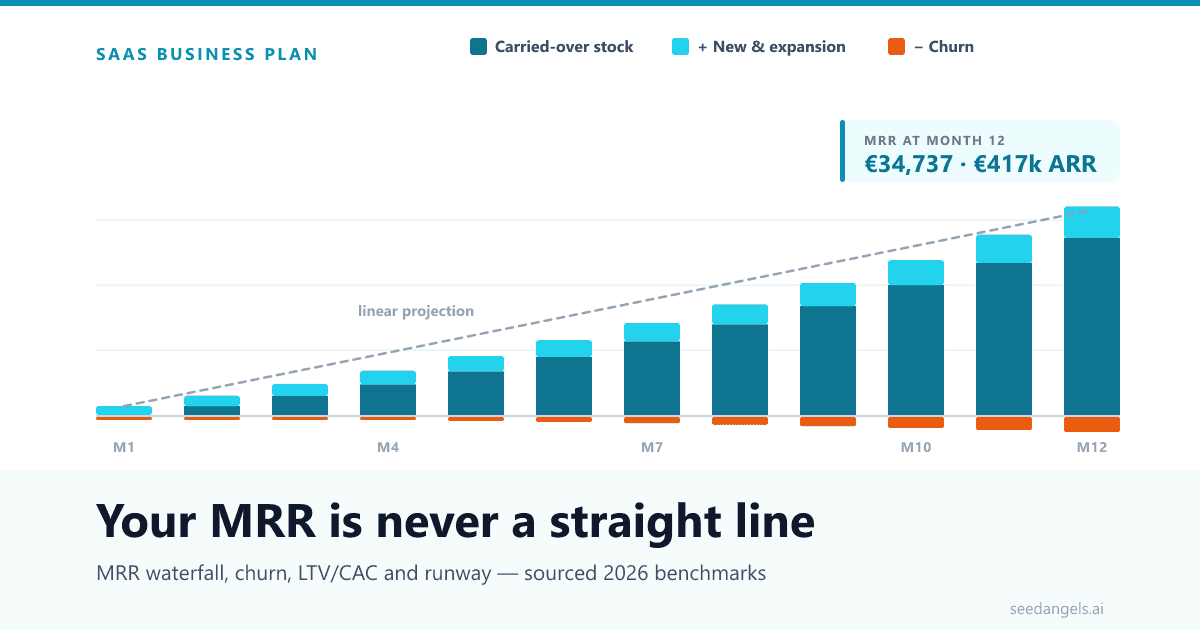
By month 12, MRR reaches €34,737, or €417k in ARR. Three readings are worth making before moving on.
First, the curve is not a straight line: it accelerates, because Expansion applies to a growing base. Second, cumulative churn over the year represents €3,027 of lost MRR, the equivalent of twelve customers reacquired for nothing. Third, the Customers column does not grow at the same pace as MRR: expansion is what opens the gap, and that gap is exactly what an investor is looking for.
One last reflex: build three versions of this table (conservative, base, optimistic) varying only acquisition and churn. Presenting the base case while being able to quantify the other two is the strongest signal of command you can send.
Churn: the one parameter that decides everything
Below 1% monthly churn, roughly 11% per year, you are in excellent territory. Above 2% per month (21.5% per year), your growth becomes structurally hard to sustain. These thresholds are not cosmetic: they set the ceiling on your company.
The proof fits in one formula. At constant acquisition, your MRR converges towards a limit: monthly New ÷ churn rate. With €3,000 of new MRR per month:
| Monthly churn | Annual equivalent | MRR ceiling | ARR ceiling |
|---|---|---|---|
| 1% | 11.4% | €300,000 | €3.6M |
| 2% | 21.5% | €150,000 | €1.8M |
| 3% | 30.6% | €100,000 | €1.2M |
The same commercial effort produces a €3.6M ARR company or a €1.2M one, on two points of churn. Over 36 months starting from €10,000 of MRR, the divergence is already stark: €98,040 of MRR at 1% churn against €69,938 at 3%, a 29% accumulated gap with no other assumption changed.
Market benchmarks confirm the hierarchy, with one caveat worth keeping in mind: these are international benchmarks published by private firms, not statistical standards. The B2B SaaS Benchmarks 2026 report from data-mania reports 3.5% average annual churn across all segments, but the spread between segments is considerable: under 1% per month in enterprise, against 3% to 7% per month in SMB. Position yourself against your segment, never against the overall average.
The practical consequence for your business plan: if your churn is above 2% per month, do not present a declining churn assumption without justification. State the real number, then explain the product plan that will bring it down, with its milestones. A founder who knows their churn and is attacking it is more credible than one whose model assumes it will disappear on its own.
The metrics investors check, and their 2026 thresholds
Once the waterfall is in place, the investor derives a series of ratios from it to gauge your efficiency. These are the ones that come up every time, with their formula and market threshold.
| Metric | Formula | Expected threshold | Source |
|---|---|---|---|
| Gross margin | (Revenue − direct costs) ÷ revenue | > 75% | G-Squared CFO |
| NRR (net revenue retention) | Cohort MRR at 12 months ÷ its initial MRR | Median 101%, top 111%+ | G-Squared CFO |
| LTV/CAC | Lifetime value ÷ acquisition cost | ≥ 3:1 (target ~3.0x) | Wall Street Prep |
| CAC payback | CAC ÷ (ARPA × gross margin) | Median 15 to 18 months | data-mania |
| Burn multiple | Net burn ÷ net new ARR | < 2.0x; < 1.0x = excellent | Growth Equity Interview Guide |
| Rule of 40 | Growth (%) + EBITDA margin (%) | ≥ 40% | Wall Street Prep |
Three clarifications separate quoting these numbers from understanding them.
SaaS gross margin is not 95%. It is calculated after hosting, payment fees, customer support and onboarding costs. G-Squared CFO sets the target at 75% or higher and folds that margin into what it calls the "SaaS Triangle": gross margin above 75%, a controlled CAC payback, and net revenue retention of at least 101%. A company that satisfies all three operates from a position of strength; one that satisfies only one is compensating on the others.
CAC payback reads relative to your sales model. Data-mania puts the median at 15 months, but with a wide spread: 6 to 12 months in product-led growth, 12 to 18 months in sales-led, 18 to 24 months in account-based marketing. A 20-month payback is not a bad number in itself; it is one if your model is supposed to be self-service.
NRR is the ratio that separates the field. Above 100%, your existing base grows on its own: expansion covers churn. It is the only indicator proving your product gains value over time. These same metrics also structure the traction slide and the KPIs investors expect in your deck, but with a different aim: there you present them; here you model them.
A word on valuation, since these thresholds lead straight to it: data-mania puts private SaaS multiples between 3x and 7x ARR, with a 4.5x median. That median is what a fund applies to your projected ARR before any negotiation, which is why startup valuation methods for SaaS rest on recurring revenue multiples rather than EBITDA multiples.
From MRR to a complete financial forecast
The MRR waterfall gives you the revenue line. A complete business plan needs three more: P&L, cash flow, and funding plan.
The three-year P&L
Annualise your waterfall to get the revenue line, then build the cost side. The items generic templates systematically forget, and that weigh heavily in SaaS:
- Hosting and infrastructure, which scale with usage rather than with revenue: model them per active customer, not as a percentage of revenue.
- Payment processing fees, typically 1.5% to 3% of collected amounts depending on your provider and payment mix.
- Customer support, which grows with the installed base: a customers-per-support-agent ratio is more realistic than a fixed amount.
- Onboarding costs, particularly in B2B where go-live can absorb several person-days per signed account.
These four items make up most of your cost of revenue, and therefore your gross margin, the same one that has to clear 75%. It is the general logic of building a financial forecast applied to the specifics of recurring revenue: the same three statements, but a revenue line modelled as a stock and a cost of revenue that is anything but fixed.
Three years is enough. The first 12 to 18 months should be detailed month by month; beyond three years the precision is illusory and investors know it.
The monthly cash flow plan
This is the statement that exposes the timing gap specific to SaaS: you pay CAC at signature and collect revenue over twelve months. Strong growth therefore consumes cash, and a single month of negative cash is enough to sink a deal, even with a flawless P&L.
Two variables to model explicitly, because they change everything: the monthly/annual split of your subscriptions (annual billing collects twelve months upfront and transforms your cash profile), and B2B payment terms, often 30 to 60 days, which delay every collection by that much.
Runway and funding need
Runway is how long your cash covers your burn. Wall Street Prep gives the reference formulas:
Gross burn = total monthly cash expenses
Net burn   = monthly cash expenses − monthly cash collections
Runway     = cash balance ÷ net burn
Aim for 18 to 24 months of runway post-round. That is what lets you reach the milestones for the next raise without going straight back out. Wall Street Prep observes that startups typically restart fundraising at around 5 to 8 months of remaining runway, which means a 12-month runway puts you back in the market by month six. Your funding need then follows mechanically: cumulative net burn to the target milestone, plus a safety buffer. That same runway also caps how many changes of direction you can still fund: with a full test cycle consuming four to six months, cash decides how many pivots are possible long before the team's conviction does.
These three numbers (burn, runway, funded milestone) are exactly what you need to be able to present in your pitch deck, because an investor reconstructs them in their head while you talk and notices immediately when they do not reconcile.
SeedAngels builds your business plan and financial forecast from your recurring revenue assumptions, MRR waterfall included, without asking you to build the spreadsheet yourself. Try SeedAngels for free →
The mistakes that give away a fabricated SaaS forecast
An experienced SaaS investor spots an invented model in under two minutes. Here are the six signals they look for, in order of severity:
- Linear growth. MRR rising by the same amount every month proves no waterfall was built: neither churn nor expansion produces a straight line.
- Churn held at 0%. No SaaS has zero churn, year one included. A model without churn is a model without real customers.
- CAC that never rises. The first customers come from your network and cost little; the next ones cost more. Data-mania reports a median CAC of $1,200 per customer, up 60% over five years. Flat CAC across three years is an assumption to defend, not a given.
- 95% gross margin. It signals that hosting, support and payment fees were forgotten. The market benchmark is above 75%, not above 90%.
- Acquisition with no budget. A new-customer curve that accelerates with no matching marketing spend line leaves the rest of the model unfunded.
- ARR quoted with no underlying MRR. ARR is only an extrapolation (MRR × 12); quoted alone, it hides precisely what the investor wants to see. The request for the monthly curve is automatic.
What these six have in common: each one removes from the model the variable that would make it hard. That is also what makes them easy to spot: a forecast with no friction anywhere is a forecast with no reality in it.
Conclusion
A credible SaaS business plan is not distinguished by the ambition of its numbers but by the mechanism that produces them. The MRR waterfall is that mechanism: four explicit assumptions, four separated movements, a monthly table the investor can recompute line by line. Everything that follows (P&L, cash flow, runway, ratios) falls out of it.
Do the exercise before your next meeting. Rebuild your next twelve months from the four assumptions, check that your curve is not a straight line, calculate your MRR ceiling (New ÷ churn) and hold it against the ambition stated in your deck. If the ceiling arrives before the target, you have just found, ahead of the investor, the question your model needs to answer.
You can also have your business plan analysed for free to find out whether your revenue assumptions survive an investor's reading.
FAQ
How do you write a business plan for a SaaS company?
Start from the MRR waterfall rather than an annual revenue figure: set your four assumptions (new customers per month, average ticket, monthly churn, expansion rate), roll them forward month by month over 12 to 18 months, then annualise into a three-year P&L. Add a monthly cash flow plan and calculate your runway. Every assumption must stand on its own.
What is an MRR waterfall?
The MRR waterfall breaks monthly recurring revenue into four movements: ending MRR = starting MRR + New (new customers) + Expansion (upgrades) − Churn (lost customers) − Contraction (downgrades). It replaces a revenue projection with a stock model, which is the only credible way to forecast a subscription business.
What churn rate is acceptable?
Below 1% per month, roughly 11% per year, churn is considered excellent. Above 2% per month (21% per year) growth becomes structurally hard to sustain because your MRR hits a mechanical ceiling. These are international market benchmarks: data-mania reports 3.5% average annual churn, but 3% to 7% monthly in the SMB segment.
What is the difference between MRR and ARR?
MRR is monthly recurring revenue; ARR is its annualised projection: ARR = MRR × 12. ARR is therefore not booked revenue but an extrapolation of the current month. An investor shown an ARR figure without the underlying MRR curve will always ask for it, because only the monthly waterfall reveals churn.
What LTV/CAC ratio should you aim for?
The market benchmark is 3:1 as a minimum, meaning three dollars of lifetime value per dollar of acquisition cost. Wall Street Prep puts the target at roughly 3.0x; below 1.0x you are failing to monetise customers. Above 5.0x the signal reverses: you are likely underinvesting in acquisition and leaving market share on the table.
How many months of runway should you present?
Aim for 18 to 24 months of runway post-round: that is what lets you hit the milestones for the next raise without going straight back out to fundraise. Runway is cash on hand divided by monthly net burn. Wall Street Prep notes that startups typically start raising again at around 5 to 8 months of remaining runway.
How many years should a SaaS forecast cover?
Three years for the P&L, with the first 12 to 18 months detailed month by month in the MRR waterfall and cash flow plan. Beyond three years the precision is illusory and investors know it. A fifth year is only justified on a fund's explicit request or for a model with a very long sales cycle.