What a competitor's accounts actually tell you
Most business plans are rejected not because their numbers are wrong, but because they are compared to nothing. A lender or an investor reading "£280,000 of revenue in year one" has no way of knowing whether that is ambitious, cautious or fanciful. Read instead that "£280,000 in year one, when the competitor half a mile away has been trading for six years and turns over £540,000 with four staff", and there is suddenly a trajectory that can be assessed.
That information exists, it is public, and in most cases it is free. Limited companies are required to file annual accounts with their national registry, and those filings are open to anyone. You need no subscription, no contact on the inside and no grey-area technique: the company name is enough to get started.
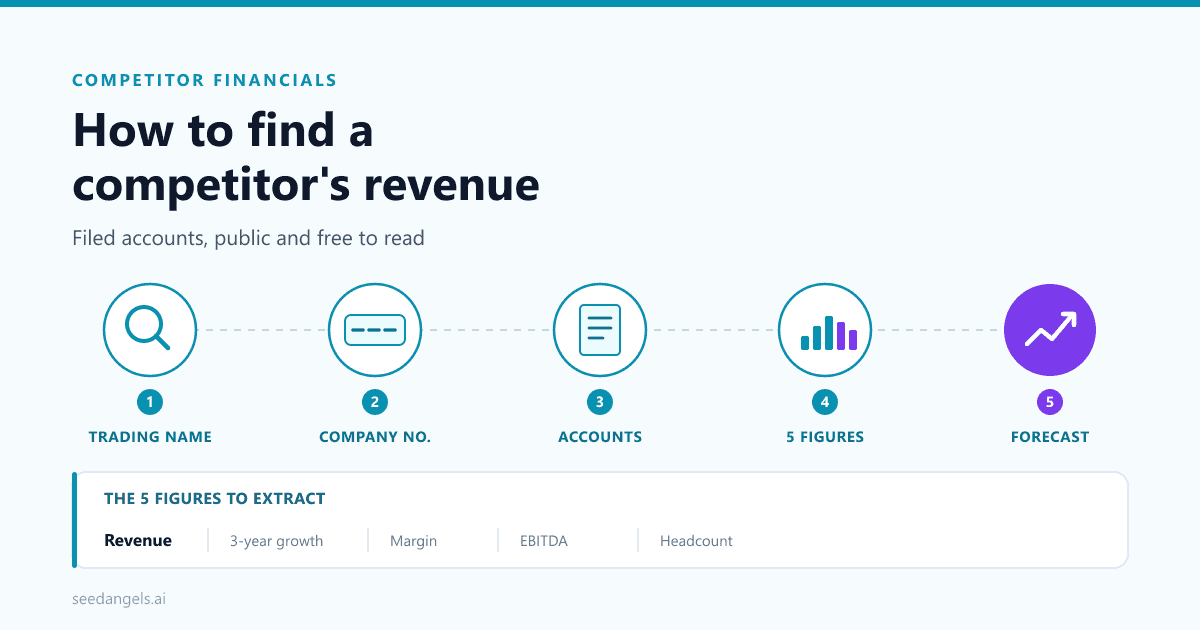
This article walks the full chain, from a competitor's trading name to a line in your own forecast: finding the right legal entity, retrieving the accounts, extracting the five figures that genuinely matter, benchmarking them against their sector, and turning them into defensible assumptions. It is the quantitative half of a wider job: the competitive analysis in your business plan covers the comparison grid, the positioning map and the written summary, while this one supplies the data that fills them. It also covers the case everyone else dismisses in a sentence, even though it is the most common on a local market: the competitor who publishes nothing, and what you do then.
By the end, you should have real figures for three competitors and know what to do with them.
Yes, it's legal: where this data comes from
Yes, looking up a competitor's accounts is entirely legal. Limited companies must file annual accounts with their national company registry every year, and those filings are published. In the UK, the Companies House service lets anyone search a company by name, number or officer and download its accounts free of charge. In the United States, listed companies file their annual 10-K with the SEC, published on the EDGAR database. Across the EU, each member state runs an equivalent register.
This is not corporate espionage. It is the ordinary use of a public register, the same one banks, credit insurers and suppliers consult before opening an account for a new client.
The limit worth knowing straight away is scope. Not every business is covered.
Who has to file
- Companies limited by shares or by guarantee
- Limited liability partnerships
- In the UK, filing is due nine months after the end of the financial year for a private company (GOV.UK)
Who is outside the requirement
- Sole traders and self-employed individuals
- Ordinary partnerships
- Unincorporated associations
- Any business that has never registered as a company
That boundary alone explains half of all fruitless searches. If your competitor trades as a sole trader, no document exists: stop looking and go straight to the fallback plan.
Step 1: identify the right competitor (and its registration number)
The most expensive mistake at the outset is searching for a brand instead of a company. The name above the door is a trading name; accounts are filed by a legal entity that often carries a different name, sometimes three letters and a number. A single local outlet may correspond to a trading company, a property company that owns the premises and a holding company above both, and only the trading company is of any use to you.
Work in this order:
- Start from the trading name and the address. Search the registry by name, filtering by location. You will get one or more entities and their company registration number, the identifier that follows the business everywhere.
- Isolate the entity that trades. Where several companies share an address, check the industry classification code (SIC in the UK, NAICS in the US): the code matching the real activity identifies the operator, while a property-management code flags a company that only holds the building. Note the incorporation date too: you will need the trading age to interpret the figures.
- Check the number of sites. Revenue of £2.4m does not mean the same thing generated by one outlet or by seven. This is the single biggest cause of distorted comparison.
- Record the classification code, you will need it. It is what lets you pull average ratios for the sector at step 4, and decide whether the figures you found are good, normal or poor in that trade.
Build a list of three to five competitors, not fifteen. The criterion is not geographic proximity alone but comparability: same catchment area, same customer segment, similar order of size. Deliberately include at least one established, profitable competitor, which sets the realistic ceiling for your trajectory, and, if you can, one recent entrant whose early years will look like yours.
Step 2: get hold of the accounts
The full procedure takes five steps, whichever registry you use:
- Search the company by name or, better, by registration number.
- Open the filing history and locate the most recent set of accounts.
- Check what kind of accounts they are: full, small or micro-entity. This determines whether you will see a profit and loss account at all.
- Record the last three financial years, never the latest alone. The slope matters more than the level.
- Download the document itself rather than relying on a third-party summary, so you read the actual line.
Allow ten minutes per competitor the first time, three after that.
Where to search, registry by registry
| Registry | Coverage | What's free | Format of accounts | Main limitation |
|---|---|---|---|---|
| Companies House (UK) | All UK-registered companies and LLPs | Full filing history, accounts, officers, charges | PDF, increasingly iXBRL | Small companies may omit the profit and loss account |
| SEC EDGAR (US) | Listed companies and large filers | Full 10-K, 10-Q and 8-K filings | HTML and XBRL, very detailed | Private US companies file nothing |
| National EU registers | Companies registered in each member state | Varies by country: often the balance sheet, sometimes full accounts | Local language, PDF | Coverage and cost differ widely by country |
| Commercial data aggregators | Cross-border, consolidated | Basic identity data, sometimes an estimated revenue figure | Reworked summary | Estimated figures presented alongside filed ones: check which is which |
One habit worth keeping: when two sources show different figures for the same company, one of them is showing an estimate. Go back to the filed document to settle it. A filed figure is evidence; an estimated one is a supplier's model.
Going to the primary source
If you are analysing dozens of companies rather than three, most registries expose a bulk or API route to the same data: Companies House publishes a free developer API, and the SEC exposes EDGAR full-text search and structured XBRL company facts. That is worth the setup for systematic market mapping, and unnecessary for a business plan.
One point matters regardless of the route: going to the primary source does not surface data the law allows a company to withhold. A profit and loss account omitted under a small-company exemption is absent from the API exactly as it is absent from the web page.
Step 3: the 5 figures to extract (and what they reveal)
A full set of accounts runs to hundreds of lines. Five are enough for a business plan. For each, the same grid: where to find it, what it says, and the interpretation trap that makes it misleading.
Revenue: the level, never on its own
Where to find it: the top line of the profit and loss account, when one is filed.
What it says: the size of the activity, and therefore the order of magnitude reachable in your area. If an established competitor plateaus at £400,000, targeting £900,000 in year two on the same market needs a solid explanation: a new segment, a different channel, a wider catchment.
The trap: revenue says nothing about money earned. A company turning over £3m can lose money every year. This is the most widespread confusion, and it produces the most fragile business plans: copying a competitor's revenue without looking at what remains means copying a model without knowing whether it works. Check the length of the accounting period too: a first period can cover 4 or 18 months, which makes any comparison meaningless.
Growth: the slope across three years
Where to find it: by comparing revenue across three consecutive filings.
What it says: the dynamic of the local market and the competitor's position within it. Three years of steady growth in a mature market signals someone taking share, and therefore someone who will compete for your customers. Two years of decline signals either an opening or a shrinking market: work out which by checking whether every competitor is declining at once.
The trap: a single year tells you nothing. A 40% jump can come from a rebound after a bad year, an acquisition of a trading business, or a change of scope. This is also why you should check the date of the most recent filing: for a small company, the latest available accounts often cover a year that ended eighteen months ago.
Margin: what actually remains
Where to find it: gross profit as a proportion of revenue, where the profit and loss account is filed. Where it is not, the balance sheet still shows accumulated reserves, a slower but real proxy for whether the business has been profitable over time.
What it says: how solid the model is. Two restaurants on identical revenue are not the same business if one runs a 72% gross margin and the other 58%: the second works just as hard for a much thinner cushion.
The trap: high revenue on a thin margin is a fragile model, and often a positioning opportunity. If every local competitor holds low margins by chasing volume, a more expensive, higher-quality offer can be defended. But you have to have seen it in the figures before writing it into the plan.
EBITDA: does the trading activity make money
EBITDA measures what the business generates before interest, tax, depreciation and amortisation. In plain terms, it strips out how the company is financed and how it writes down its assets, leaving what trading itself produces. A positive EBITDA means operations create value; a negative one reveals a structural profitability problem that no financing arrangement will fix.
Where to find it: it is rarely stated as such: rebuild it from operating profit by adding back depreciation and amortisation, both disclosed in the notes.
What it says: the real health of the trading activity, independent of financing choices. It is a better indicator than bottom-line profit, which is highly sensitive to depreciation policy, director remuneration and tax planning. A competitor with near-zero net profit but a comfortable EBITDA is in good health: it is investing, or paying its owners.
The trap: comparing EBITDA in absolute terms across companies of different sizes teaches you nothing. Always express it as a percentage of revenue to get a comparable rate.
Headcount: the denominator that makes everything comparable
Where to find it: average employee numbers are disclosed in the notes to the accounts, and are one of the few figures small companies still have to file.
What it says: the organisational model, and above all revenue per employee, the only way to compare a four-person competitor with a thirty-person one. A business at £480,000 with 6 staff (£80,000 per head) and one at £700,000 with 12 staff (£58,000 per head) do not have the same productivity, whatever the apparent gap in size.
The trap: the disclosed average excludes neither part-time weighting issues nor seasonal staff cleanly, and working directors may or may not be counted. Use revenue per employee as an order of magnitude, never as a precise measure. That same ratio becomes your main estimation tool when accounts are unavailable.
| Figure | What it reveals | The trap |
|---|---|---|
| Revenue | The size reachable in your area | Says nothing about profitability; check the period length |
| 3-year growth | Market dynamic and the competitor's position | A single year means nothing |
| Margin | How solid the business model is | High revenue on a thin margin is fragile, and attackable |
| EBITDA | Whether trading makes money on its own | Not comparable in absolute terms: express it as a % of revenue |
| Headcount | Productivity, via revenue per employee | Averages, excluding seasonal and part-time nuance |
One methodological point to close on: these five figures describe a performance, not a strategy. Accounts say nothing about product mix, profitability per customer, contracts in hand or the quality of the team. They bound what is plausible, which is a great deal, but they do not replace field observation.
Step 4: compare against the sector, not just the neighbours
A 22% margin means nothing in isolation. It is poor in real estate, acceptable in business services, rather good in construction. Without a sector reference, you risk mistaking the norm of a trade for a competitor's weakness, and building a business plan on an imaginary advantage.
National statistics offices publish average ratios by sector free of charge, which is where that reference comes from. To give an order of magnitude, France's INSEE reports the following for 2023, published on 18 September 2025 (INSEE sector ratios):
| Sector | Value added rate | Margin rate |
|---|---|---|
| All market sectors | 28.3% | 30.7% |
| Manufacturing | 23.9% | 35.9% |
| Construction | 31.5% | 22.8% |
| Retail and wholesale | 15.7% | 30.2% |
| Transport and storage | 38.2% | 26.6% |
| Information and communication | 44.3% | 29.9% |
| Real estate | 48.4% | 59.4% |
| Business services | 52.0% | 22.1% |
The spread between sectors is the point, and it holds across developed economies even where the absolute levels differ. Within retail and wholesale alone, the same source puts the gross commercial margin at 15.3% in motor trade, 21.6% in wholesale and 28.7% in retail. A wholesaler on a 20% gross margin is therefore normal for its trade; a retailer on the same rate is clearly below its own.
Use the equivalent published by your own national statistics office wherever you can: in the UK, the ONS annual business survey; in the US, the Census Bureau and the SBA's own market research and competitive analysis guidance. Two cautions apply everywhere. Date these figures explicitly in your business plan: sector ratios structurally run two years behind, and an informed reader knows it. And remember that national averages aggregate very different company sizes: real estate's high margin rate is largely a composition effect of countless companies with no employees, which tells you nothing about any individual operator.
Sector benchmarking is only half of the framing work. It tells you whether your competitor performs well in its trade; it does not tell you whether the market is big enough to take you. For that you need to size your market with the TAM SAM SOM method, which starts from the number of potential customers rather than from the accounts of identified companies. The two exercises complement each other, and an investor expects both.
When the accounts aren't there: the fallback plan
You will run into this, probably by the second competitor on your list. It is the most common case on a local market, and the one most guides dispose of in a sentence.
Why this competitor publishes nothing
Three situations, worth telling apart before giving up.
It is not required to file. Sole traders, ordinary partnerships and unincorporated businesses file no accounts, and never will. On a local market, they can represent a substantial share of the players.
It files reduced accounts. Smaller companies may legally leave out part of the document. In the UK, the thresholds are met on any two of the three criteria (GOV.UK):
| Category | Turnover | Balance sheet total | Employees | What can be left out |
|---|---|---|---|---|
| Micro-entity | ≤ £1m | ≤ £500,000 | ≤ 10 | Simplified balance sheet only, minimal notes |
| Small company | ≤ £15m | ≤ £7.5m | ≤ 50 | Directors' report and profit and loss account |
Hold on to the second row, the most useful in practice: for a small company, the balance sheet remains public even when the profit and loss account is withheld. You will not get the revenue figure, but you will get the balance sheet total, shareholders' funds, debt and usually the average headcount, enough to size the business and judge its solidity.
Note that this is changing. Under the Economic Crime and Corporate Transparency Act, small companies will be required to file a profit and loss account alongside the balance sheet and directors' report, abridged accounts are being removed, and from 1 April 2028 all accounts must be filed through commercial software in iXBRL format (Changes to UK company law). Competitor revenue that is invisible today will become visible.
It is simply late. A UK private company files nine months after its year end, so a December year end may not appear until the following autumn. Check the date of the last filing before concluding there is nothing there: sometimes it is enough to come back in three months.
Five indirect estimation methods
When the figure does not exist, you rebuild it. The principle is to lean on comparable competitors' observed revenue, published sector statistics and trade ratios such as revenue per employee or per square metre, then adjust them to local conditions.
-
Revenue per employee applied to headcount. Take the sector average (either from published statistics or calculated yourself on two competitors whose accounts are public) and multiply by the opaque competitor's headcount. A beauty salon with 4 staff in a sector running at £48,000 per employee sits around £192,000. Order of magnitude, not measurement.
-
Revenue per square metre for retail. Sales floor area is observable, and sometimes published in planning consents. Multiply it by the trade's revenue per square metre, available from trade associations. A 120 m² unit in a segment running at £3,900/m² gives roughly £468,000.
-
Capacity × occupancy × average spend. The most reliable method in restaurants, hotels and any capacity-constrained service. A 45-cover restaurant running two sittings on Thursday to Saturday and one on other days, open 300 days, at 65% average occupancy and a £24 average spend: roughly 400 sittings × 45 × 0.65 × £24 ≈ £280,000. Every assumption is arguable, but each one is visible from the dining room.
-
Local trade and footfall studies. Chambers of commerce, business improvement districts and local authorities regularly publish shopper surveys giving a catchment's spend, leakage rates and sometimes estimated turnover by trade across the area. It is the best source for checking that an individual estimate remains compatible with the size of the local market.
-
Weak signals, cross-referenced. Hiring pace, new site openings, published funding rounds, cumulative customer review counts, visible refits. None gives a figure, but together they confirm or contradict a trajectory. A competitor that has opened two sites in three years is not stagnating, whatever the single entity you found may suggest.
Always cross-check two methods. If the headcount estimate and the capacity estimate converge within 15%, you have a figure that will hold up in front of a lender, provided you present the method, not just the result. If they diverge by a factor of two, one assumption is wrong: fix it before going further.
One warning applies throughout: figures collected elsewhere have to be reconciled with the local economic environment, the range of products or services offered and the customer segment targeted. Transposing a national ratio onto a town of 4,000 people without adjusting it is a classic error, and it shows immediately.
Above all, never present an indirect estimate as a certain figure. Write "estimated revenue £192,000 (revenue-per-employee method, 2023 sector ratio)". That transparency strengthens your case; a bare assertion weakens it.
Step 5: turning these figures into forecast assumptions
This is the step almost nobody takes. You have a table of competitors; now you need forecast lines out of it. Here is a full worked case.
The situation. You are opening a beauty salon in a mid-sized town. Three competitors have been analysed:
| Competitor | Trading age | Latest revenue | 3-year growth | Headcount | Revenue / employee |
|---|---|---|---|---|---|
| A, town-centre leader | 9 years | £355,000 | +4%/yr | 6 | £59,000 |
| B, comparable | 5 years | £208,000 | +2%/yr | 4 | £52,000 |
| C, recent entrant | 2 years | £82,000 (estimated) | n/a | 2 | £41,000 |
What it gives you. The local ceiling for an established operator sits around £355,000. A competitor comparable to you in size runs at £208,000. And most valuable of all, C tells you that a two-person operation does roughly £82,000 in its second year. That is your credible starting point, far more useful than the leader's revenue.
The assumptions that follow:
- Year 1 revenue: aim below C at the same age, so £60,000 to £70,000: a new entrant has no reputation, no customer list and no repeat business.
- Year 3 revenue: converging on B's level, £175,000 to £200,000, reachable with a second chair from year 2.
- Target productivity: £48,000 to £52,000 revenue per employee, consistent with B and prudent against A.
The general rule fits in one sentence: in year one, stay below the comparable established competitor, and be able to justify the gap. A business plan that claims the nine-year-old leader's revenue in its first year disqualifies itself in a line. A plan that starts below the youngest competitor and explains the catch-up year by year reads as reasoning.
Those three figures (year 1 revenue, year 3 trajectory, revenue per employee) are exactly the entry point of a forecast. What remains is turning them into volumes, prices and months, which is what our method for building a revenue forecast covers: this article gives you the real market data, that one shows how to convert it into a monthly projection.
The three assumptions to source from a competitor
- The revenue level achievable in year one and at cruising speed, bounded by the nearest comparable competitor.
- The realistic margin rate for your activity, calibrated on what competitors actually earn rather than on what you hope for.
- The productivity per employee, which drives your hiring plan and therefore your payroll.
Once those three are set and sourced, they have to flow down into the profit and loss account, the cash flow statement and the funding plan: that is where inconsistencies surface, particularly between hiring pace and available cash. Our guide to building your financial forecast works through that mechanism statement by statement.
That chaining is precisely what SeedAngels automates: your market assumptions feed the financial statements directly, and inconsistencies between revenue trajectory and hiring plan surface as you write.
The mistakes that invalidate the whole analysis
- Confusing revenue with profit. The fix: always read revenue alongside EBITDA. A competitor at £2m of revenue with negative EBITDA is a model to avoid, not a target to hit.
- Relying on a single year. The fix: three years minimum. Any one year can be exceptional in either direction.
- Using old accounts without saying so. The fix: date every figure in your business plan. "2023 revenue" and "revenue" do not read the same way in 2026.
- Comparing without a common denominator. The fix: bring everything back to revenue per employee, per square metre or per cover. Otherwise you are comparing sizes, not performance.
- Taking an estimated figure for a filed one. The fix: check how the source labels it and, at the slightest doubt, open the filed document.
- Concluding that an invisible competitor doesn't exist. The fix: the absence of accounts is a legal category, not a sign of weakness. Some of the most profitable operators on a local market publish nothing.
- Analysing fifteen competitors superficially. The fix: three complete analyses beat a table of names. Depth is what makes the case credible.
Conclusion
The point of this exercise is not to find out what the business next door earns. It is to make your own assumptions defensible. A revenue forecast anchored to the real accounts of three identified competitors changes in nature: it stops being an ambition and becomes a projection, with a method your reader can reproduce.
Three principles are enough to hold that standard. Never read a figure alone: revenue with margin, margin with the sector, headcount with revenue per employee. Own what you don't know: an estimate presented as such, with its method, inspires more confidence than a figure asserted without a source. And set year one below the nearest comparable competitor, then explain how you close the gap.
Go back to the financial section of your business plan now and ask it one question: can each of your key figures be traced to a real, named competitor? If the answer is no, it is not the presentation that needs reworking, it is the foundation underneath it.
To turn those findings into a complete, coherent forecast, SeedAngels builds the business plan and the financial statements inside one document. Try SeedAngels for free →
FAQ
Is it legal to look up a competitor's accounts?
Yes. Limited companies are required to file annual accounts with their national company registry, and those filings are public. In the UK, Companies House publishes them free of charge; in the US, listed companies file with the SEC. You are not circumventing anything: you are reading information the law makes public. Only businesses outside the filing requirement escape this.
How do I find a company's revenue for free?
Search the company by name or registration number on your national registry: Companies House in the UK, SEC EDGAR for US-listed companies, the national business register elsewhere in Europe. Open the filing history, download the most recent accounts, and record the figures for the last three financial years rather than the latest one alone.
Why can't I find this competitor's accounts?
Three likely reasons. The business is not required to file: a sole trader, a partnership, or an unincorporated business. It qualifies as a micro-entity or small company and has filed reduced accounts that leave out the profit and loss account. Or the filing is simply late. In all three cases, switch to indirect estimation methods.
What is the difference between turnover and profit?
Turnover is the total value of sales before any costs. Profit is what remains after costs. A company can post a large turnover and still lose money every year. Reading turnover alone is the most common mistake in competitor analysis: always pair it with a margin or an operating profit figure before drawing conclusions.
How do I estimate the revenue of a sole trader or a local shop?
Use ratios. Multiply headcount by the average revenue per employee in the sector, or floor space by revenue per square metre. For restaurants and hotels, rebuild covers or rooms × occupancy rate × average spend. Cross-check two methods: if they converge, your estimate will hold up in front of a lender.
What is EBITDA and why look at it?
EBITDA measures what the business generates before interest, tax, depreciation and amortisation. It shows whether the trading activity itself makes money, independently of how the company is financed or how it depreciates its assets. A positive EBITDA means operations create value; a negative one signals a structural problem that no financing arrangement will fix.
How many competitors should I analyse?
Three to five is enough, provided they are genuinely comparable: same catchment area, same customer segment, similar size. A thorough analysis of three relevant competitors beats a table of fifteen names with no figures. Include at least one established, profitable competitor: that is the one that sets the realistic ceiling for your own trajectory.