The survey that produces no numbers
You have 140 responses, 82% of people say they are "interested", and you still don't know what revenue to put in your forecast. That is the fate of most market research surveys copied from online question banks: they ask people what they think of your idea, not what they do.
The problem is not the number of responses. It is the questions. "Would you be interested in a new beauty salon in your neighbourhood?" produces a flattering percentage and no usable data. "How much did you pay for your last treatment?" produces an average spend that you can multiply, compare and defend in front of a lender.
This article starts from one principle: a survey is only useful if every answer becomes a number in your business plan. You will find the questions sorted by the number they produce, the ones to delete and how to rewrite them, a simple rule for how many responses to aim for, and three complete templates, ready to copy, for a local business, a B2B service and an app. Each one ends with the calculation that turns the answers into revenue.
What is a market research survey?
A market research survey is a set of standardised questions asked to a sample of potential customers to measure their buying behaviour (who buys, how often, how much, from whom) and turn it into numbers: size of demand, acceptable price, and the share of customers you can realistically expect to win.
The key word is "measure". A survey is not there to collect opinions about your project; it is there to count. Any question that does not lead to a proportion, an amount or a frequency has to justify its place.
Where it fits in your market research
The survey comes after desk research (industry figures, competitors, local population) and after your first interviews, and before the financial forecast. It confirms and quantifies what public data and conversations have surfaced. It is one building block of market research for your business plan, not the whole study.
It does not replace validation either. Interviews and commitment tests are how you validate your idea with real customers: they prove that at least a few people will pay. The survey measures how many people behave the same way across a larger sample. A survey, however positive, does not validate an idea: it sizes a demand whose existence has already been checked.
Qualitative or quantitative
The two approaches work together. The March 2022 market research webinar deck from Bpifrance Création, the French public business-creation agency, gives a rule of thumb: about 30 people for a qualitative study, about 100 for a quantitative one.
| Qualitative study | Quantitative study (survey) | |
|---|---|---|
| Goal | Understand needs, objections, vocabulary | Measure behaviours and proportions |
| Number of people | Around thirty | 100 or more |
| Type of questions | Open, follow-ups, interviews | Closed, numerical, identical for everyone |
| What you get | Hypotheses, sales pitch, offer ideas | Frequency, spend, price, share of target that buys |
The logical order: qualitative first, to know which questions to ask and which answer options to offer; quantitative second, to put numbers on them.
Survey questions that turn into business plan numbers
Here are the seven families of questions that feed a forecast directly. All of them except the last are about the past or the present: that is what makes them reliable.
| Question (past or present tense) | Number produced | Use in the business plan |
|---|---|---|
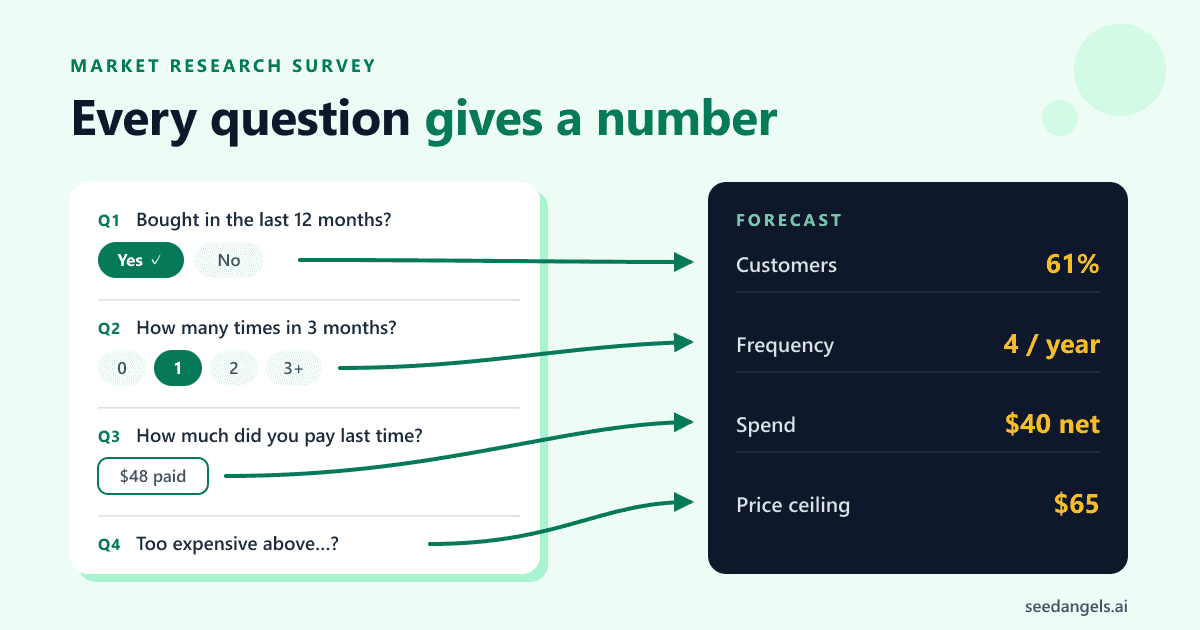
| "In the last 12 months, have you bought [category]?" | Share of the target that buys | Number of potential customers |
| "How many times in the last 3 months?" | Purchase frequency | Sales per customer per year |
| "How much did you pay last time?" | Current spend | Average selling price, net of VAT or sales tax |
| "Where, or from whom, do you buy today?" | Split between competitors | Reachable market share, competitive map |
| "What would make you switch provider?" | Switching triggers | Sales pitch, capture assumption |
| The two price questions (too expensive, too cheap) | Acceptable price range | Launch price |
| Five-point purchase intent | Stated intent, to be discounted | Prudent capture rate |
This is exactly the logic Bpifrance Création describes for estimating forecast revenue from a quantitative study: habits, quantities, frequency, average spend and accepted price.
Who already buys: the share of your target that consumes
The first question is a screener. "In the last 12 months, have you [bought / used] …?" Those who answer no leave the survey, or jump straight to the profile questions. You get two things: the share of your target that already buys the category, and a sample made only of buyers for everything that follows.
That percentage multiplies the population of your area or the number of businesses you target. It is the first factor in your market calculation.
How often and how much: past behaviour
Ask about the last occurrence, not an average habit. "How many times did you go to the hairdresser in the last 3 months?" gets a more accurate answer than "how often do you go to the hairdresser?", which everyone answers with the image they have of themselves. Same for spend: "how much did you pay last time?".
When you analyse the results, use the median rather than the mean. Three respondents who spend £300 per visit are enough to drag the mean upwards, while the median describes the typical customer.
One detail that distorts many forecasts: consumers quote prices as they paid them. Where prices generally include VAT (as in the UK and the rest of Europe) and your business is VAT-registered, convert them to net amounts before they go into your revenue line; with 20% VAT, £60 paid becomes £50 of revenue. If you are not VAT-registered, the price paid is your revenue. In the US, where shelf prices exclude sales tax, check how respondents understood the question.
Price: two questions, not one
Never ask "how much would you be willing to pay?" as a single open question. With no reference point, answers scatter in every direction, and like any hypothetical answer they commit no one: studies comparing stated and actual payments find stated amounts are higher on average (Murphy et al., 2005).
Bpifrance Création's guide to setting your prices suggests two questions that frame the answer:
- "Below which price would this product not be seen as good quality?"
- "Above which price would it be too expensive?"
For each candidate price, count the share of respondents for whom it is neither below their quality threshold (question 1) nor above their "too expensive" threshold (question 2). The range where that share peaks is your acceptable price range: the price "acceptable to the largest number of customers" that Bpifrance aims for. The Van Westendorp method adds two more questions ("cheap" and "expensive but still worth considering") to narrow the range, but the two core questions are enough for a business plan. Always ask them about a specific service, not about "your services" in general, and cross-check them against the price people actually pay today.
Purchase intent: the only future-tense question, and how to discount it
Only one question in the survey looks forward: purchase intent, asked after a short description of your offer. Use a five-point scale: definitely, probably, maybe, probably not, definitely not.
Keep only "definitely", and discount it further. People consistently overstate their future purchases. In the study by Sun and Morwitz (2010), published in the International Journal of Research in Marketing, 15.3% of respondents said they would buy a computer within a year, but only 5.7% did (US household data from 1986–87). Roughly a third of intentions turned into purchases. That ratio comes from one study on one product, so it is not a constant. It also covers all stated intentions, not just "definitely": applying it to your "definitely" answers alone, as here, is a deliberately cautious assumption, not a rule from the study.
Never add "definitely" and "probably" together: it is the fastest way to triple a revenue forecast.
Questions to delete from your survey
Some questions feel natural and produce nothing you can use. Here are the most common ones, with their rewrites.
| Question to avoid | Why | Rewrite |
|---|---|---|
| "Would you buy this product?" | Hypothetical: saying yes costs nothing | "The last time you had this need, what did you do?" |
| "How much would you be willing to pay?" | Open, no reference point, scattered answers | The two price questions + "How much did you pay last time?" |
| "How often would you come?" | Future tense, overstated | "How many times in the last 3 months?" |
| "Don't you think salons are too expensive?" | Leading: it contains the answer | "How would you rate the price of your last treatment? [scale of 1 to 5]" |
| "Are you happy with the price and the quality?" | Double-barrelled: two topics, one answer | Two separate questions |
| "Would you like a faster, cheaper service?" | Obvious answer, no information | "What would make you switch provider?" |
| Describing your concept in question 1 | Anchoring bias: everything else is read through your offer | Describe the offer only before the intent question, at the end |
The common principle is the one behind The Mom Test by Rob Fitzpatrick: ask people about their life and their past, never about your idea. The biases of friendly feedback and stated preferences are covered in our validation article; all you need to remember here is that a question in the conditional is a question to rewrite.
How many responses do you need?
For a market research survey, aim for at least 100 responses from people in your target market: the margin of error is then about ±10 points. You need close to 400 to get down to ±5 points. Beyond that, each extra response adds little precision. What matters first is that respondents are genuine potential customers.
The margin of error tells you how far the measured percentage may be from reality. If 61% of your 100 respondents visited a beauty salon in the past year, the true share is probably between 51% and 71%.
| Number of responses | Margin of error (95% confidence) |
|---|---|
| 30 | ±18 points |
| 100 | ±10 points |
| 200 | ±7 points |
| 400 | ±5 points |
| 1,000 | ±3 points |
These values are for the worst case (a 50% proportion) in a large population. Pew Research Center gives the same benchmark for its polls: about ±3 points for a sample of 1,000 people, while noting that the real total error can be close to twice the sampling margin alone. These calculations assume a random sample, which a survey shared on social media is not: treat them as an order of magnitude, not a guarantee.
Returns diminish quickly. As Bpifrance Création puts it, surveying 800 people will not give you results twice as reliable as surveying 400, while the cost doubles.
One segment, one sample
If you want to compare two groups (town centre versus suburbs, micro-businesses versus SMEs, under-35s versus everyone else), each group must reach the threshold on its own. 100 responses split across four segments give you four estimates at ±20 points, so no reliable comparison.
Small B2B targets
When your entire target is 150 companies, the logic changes. 40 responses from decision-makers who are genuinely concerned are worth more than 400 responses from consumers outside your target, and the margin of error narrows when you survey a large share of a small population. In B2B, the quality of the respondent (the person who signs the contract) matters more than volume.
Finding respondents who are not your friends
Friends and family answer to please you, and they do not necessarily look like your customers. More reliable channels:
- Quota sampling: mirror the age, gender or occupation split of your area's population in your sample, using official census figures.
- Fieldwork: outside competing businesses or in busy spots of your future area. Only keep respondents who live or work in your trade area: someone who lives 20 minutes from your future premises does not count.
- Local groups (neighbourhood associations, local Facebook groups) for a local business.
- LinkedIn, business directories and business networks (chambers of commerce, clubs) for B2B.
- Paid panels, when the target is national and consumer-facing.
A word on vocabulary, to avoid confusion: our validation method recommends around ten interviews to find out whether a problem exists. This is something else: responses to a quantitative survey, used to count.
How to build your survey in 7 steps
- Write down the numbers your forecast needs (customers, frequency, spend, price).
- Write one behaviour question per number.
- Add a screening question first and a consistency check.
- Order it as a funnel: behaviour, competitors, price, offer and intent, profile.
- Keep it to 12 to 15 questions, under 10 minutes.
- Test it on 5 people from your target before sending.
- Collect up to your threshold, then analyse (frequencies, cross-tabs, medians).
The consistency check returns to a topic already covered in a different form (for example, number of visits asked again over one month). An inconsistent answer flags a respondent ticking boxes at random. As for testing, Bpifrance is explicit: every survey should first be tested on a small part of the sample. Five people are enough to spot a misunderstood question or a missing answer option.
For tools, don't overthink it. Google Forms, SurveyMonkey or Typeform are enough for most projects; what matters is that the tool exports responses to a spreadsheet.
Surveys and GDPR
A truly anonymous survey collects no personal data. It is only anonymous if no one can be re-identified: a response combining a postcode, an age group and an email is not. As soon as you ask for an email address or a name to contact respondents again, and those respondents are in the EU or the UK, Article 13 of the GDPR requires you to inform them at the time of collection, including: who the controller is, for what purpose, on what legal basis, who receives the data, how long it is kept, how to exercise their rights and the right to complain to the supervisory authority. Make the email field optional, put it last and add that notice next to it.
Template 1: survey for a local business
Project: a one-room beauty salon run by a single beautician, in the shopping arcade of a supermarket in a commuter town. Target: women aged 18 to 64 in the town and three neighbouring towns. The survey runs outside the supermarket, at the Saturday market and through the towns' Facebook groups. If you are building this type of project, the beauty salon business plan template shows where each number from this survey sits in the plan.
The survey (13 questions)
- In the last 12 months, have you had at least one treatment in a beauty salon (waxing, facial, manicure, massage…)? [Yes → Q2 / No → Q13]
- How many times did you visit a beauty salon in the last 3 months? [0 / 1 / 2 / 3 / 4 or more]
- How much did you pay on your last visit? [Amount in £]
- Which treatments did you buy in the last 12 months? [Several answers: waxing / facial / manicure or nail polish / massage / lashes and brows / other]
- Where did you have your last treatment? [Independent salon / chain or franchise / mobile beautician / spa or hotel / other]
- What is your home postcode or ZIP code? [Free text]
- Rank these criteria by importance when choosing a salon: [price / close to home or work / quality of treatments / opening hours and ease of booking / products used / welcome]
- What would make you switch salons? [Open question]
- For a one-hour facial, below which price would you doubt its quality? [Amount in £]
- For the same facial, above which price would you find it too expensive? [Amount in £]
- A new salon is opening at [address]: online booking, open until 8 pm on weekdays, treatments with locally made products. Would you try it within the next 6 months? [Definitely / probably / maybe / probably not / definitely not]
- In the last month, how many times did you visit a beauty salon? [0 / 1 / 2 / 3 or more] (consistency check, to compare with Q2)
- Your age group [18-24 / 25-34 / 35-49 / 50-64 / 65 or over] and your employment status [employed / student / not working / retired]. If you would like to hear about the opening, your email (optional): [free text]
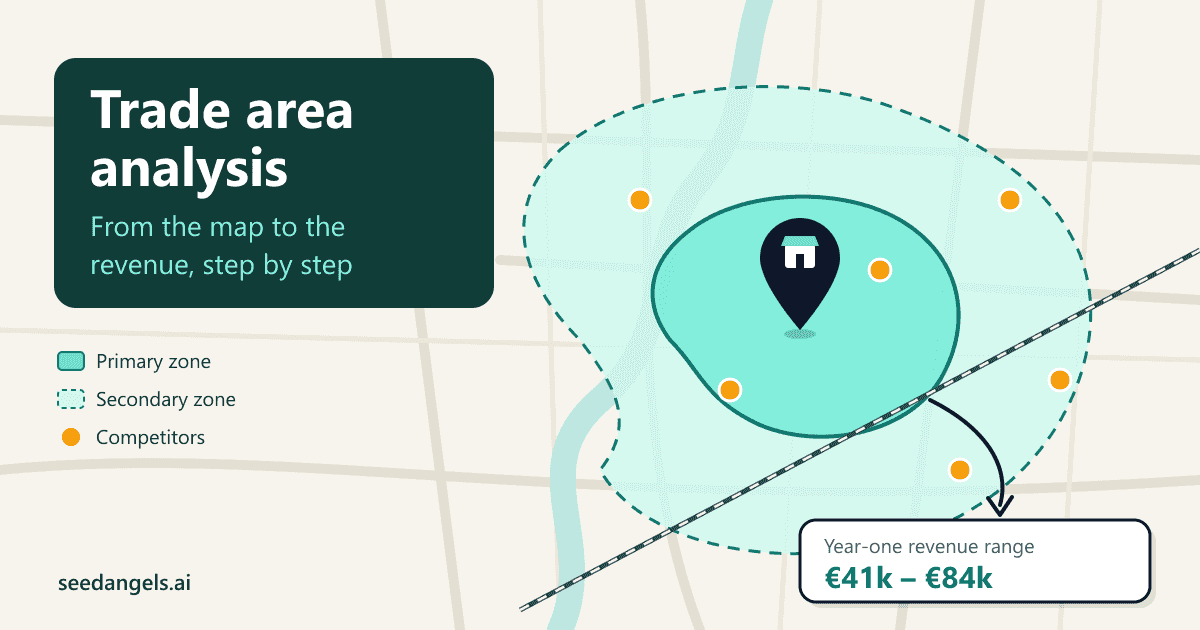
Question 6 tests the area you drew on the map against reality: by crossing postcodes with Q2 and Q3, you see how far your highest-spending customers travel from. How to map your trade area and count the people living in it with free census data is covered in a separate article; here, the survey is there to check it.
From answers to revenue
The figures below are illustrative, built to show the calculation; they describe no real town. Assume 120 responses from targeted customers:
| Step | Data | Result |
|---|---|---|
| Target population of the area | 12,000 women aged 18 to 64 (census) | 12,000 |
| Share who visit a salon (Q1) | 61% | 7,320 customers |
| Frequency (Q2, annualised) | Median: 4 visits a year | 29,280 visits |
| Spend (Q3) | Median: £48 paid, i.e. £40 net of 20% VAT (UK) | ≈ £1.17M net market |
| Intent (Q11) | 21% "definitely", discounted by two thirds | ≈ 7% trial |
| Year 1 capture | 3% of the market | ≈ £35,000 net |
Note that Q2 and Q3 only cover the 73 respondents who passed the screener, so their margin of error is wider than Q1's.
Why 3% and not 7%? Because 7% is the share of customers who would try the salon at least once, not the share who would become regulars, and in the plans we see, a new salon with no existing clientele rarely goes beyond 1–3% of its local market in its first year. Taking 3% of the market means about 880 visits a year, or 18 a week over 48 weeks: a pace one beautician with one treatment room handles easily. That is the test to run every time: compare the number coming from demand with the number coming from capacity (rooms, opening hours, treatment length). Our method to build your revenue forecast explains how to arbitrate between demand, capacity and comparables: the lowest of the three should win.
Template 2: survey for a B2B service
Project: a managed IT support company selling annual contracts to businesses with 5 to 49 employees in one local labour market. B2B needs questions that consumer surveys never ask: the respondent's role in the decision, the current budget and, above all, when the current contract ends.
The survey (12 questions)
- What is your role in choosing an IT provider? [I decide alone / I decide with others / I recommend, someone else decides / I am not involved → end]
- How many employees does your company have? [Under 5 / 5 to 9 / 10 to 19 / 20 to 49 / 50 or more]
- How many computers and sites do you manage? [Number of computers / number of sites]
- Who maintains your IT today? [Provider under contract / provider paid per call-out / an in-house employee / nobody]
- What is your annual IT support budget, excluding hardware? [Amount in $ / don't know]
- When does your current contract end? [In under 3 months / 3 to 6 months / 6 to 12 months / more than 12 months / no contract]
- How many blocking incidents (computer or network unusable for over an hour) have you had in the last 6 months? [0 / 1 to 2 / 3 to 5 / more than 5]
- Rank these criteria for choosing a provider: [response time / price / proximity / security and backups / single point of contact / references]
- For a contract covering 10 computers, below which annual amount would you doubt the offer is serious? [Amount in $]
- Above which annual amount would this contract be too expensive? [Amount in $]
- A local provider offers: on-site response within 4 hours guaranteed, monitored backups, monthly fee per computer. When your contract ends, would you consider asking them for a quote? [Definitely / probably / maybe / probably not / definitely not]
- Would you accept a 20-minute meeting for a free audit of your IT? [Yes, here are my details / no]
Question 12 is a commitment question: an accepted meeting is worth more than a "definitely". It is stage 3 of our validation method, slipped into the survey.
From answers to revenue
Question 6 changes everything: it gives you the calendar of possible sales. A client under contract does not switch provider mid-year; they switch when the contract ends. With illustrative figures, from 85 responses by decision-makers:
- 1,200 businesses with 5 to 49 employees in the area × 62% under contract with a provider (Q4) = 744 contracts in place.
- 744 × 30% ending within 12 months (Q6) = 223 contracts up for grabs this year.
- 223 × 6% (18% "definitely" at Q11, discounted by two thirds) = about 13 new clients.
- 13 × $4,800 median annual budget (Q5) ≈ $62,000 in year 1, spread according to the quarters in which contracts end.
The first figure in this calculation is the weakest: "every business in the county" is never your target. Before sending the survey, take the time to count the businesses you can actually reach by size, sector and area, using public databases.
Template 3: survey for an app or SaaS
Project: a mobile quoting and invoicing app for building tradespeople, sold as a monthly subscription. For a SaaS, the competition is not just other software: it is often the spreadsheet, the notebook or the Word template.
The survey (12 questions)
- How do you produce your quotes and invoices today? [Dedicated software / spreadsheet / word processor / paper / my accountant does it → end]
- How much do you spend per month on that tool, excluding your accountant? [$0 / under $15 / $15 to $29 / $30 to $49 / $50 or more]
- How many people in the business produce quotes or invoices? [1 / 2 / 3 to 5 / more than 5]
- How much time do you spend on it per week, on average over the last month? [Under 1 h / 1 to 3 h / 3 to 5 h / more than 5 h]
- How many quotes did you send last month? [Number]
- Have you ever dropped a business software tool? Which one, and why? [Open question]
- Who decides to buy software, and who pays for it? [Me / my partner / my accountant recommends it / other]
- What would make you change tools in the next 6 months? [E-invoicing requirements / time lost / errors or unpaid invoices / accountant's request / nothing]
- For a monthly subscription covering one user, below which price would you doubt the tool is serious? [Amount in $]
- Above which monthly price would you find it too expensive? [Amount in $]
- An app lets you write a quote on site in 5 minutes from your phone, get it signed online and turn it into an invoice. Would you subscribe within 3 months of its launch? [Definitely / probably / maybe / probably not / definitely not]
- Would you like to test the beta for free for one month? [Yes, here is my email / no]
From answers to MRR
Each answer feeds one line of the subscription model. Current spend (Q2) and the two price questions (Q9-Q10) set the subscription price; the number of people involved (Q3) gives seats per account; time spent (Q4) gives you a quantified sales argument; discounted intent (Q11) and beta sign-ups (Q12) give a first conversion rate from sign-ups to paying users.
With illustrative figures, from 150 responses by tradespeople:
- 3,000 building tradespeople you can reach in your target × 70% who write their own quotes (Q1) = 2,100 potential accounts.
- 2,100 × 5% (15% "definitely" at Q11, discounted by two thirds) = 105 subscribers.
- 105 accounts × 1.2 seats (Q3) × $19 a month (a price inside the Q9-Q10 range and consistent with current spend at Q2) ≈ $2,400 MRR, or about $28,700 in annual recurring revenue once those subscribers are on board.
These subscribers do not all arrive in month one: spread them over year 1. From there, recurring revenue and churn follow: all you have to do is plug these assumptions into the MRR cascade of a SaaS business plan.
Analysing the answers without fooling yourself
A well-built survey can be analysed in a few hours in a spreadsheet. Bpifrance names three treatments, which are enough for a business plan:
- Frequency tables: the split of answers, question by question (61% visited a salon, 30% have a contract ending this year).
- Cross-tabs: two questions crossed (spend by age group, intent by current provider). This is where the most profitable segments show up.
- Averages, which you will replace with medians for every amount and frequency.
Clean before you calculate. Remove responses where the consistency check contradicts the original question, those from people outside your target, and those completed in a few seconds if your tool records duration. Never add the "probably" answers back into purchase intent because the number looks too low.
Then record every number you keep with its exact source: "median spend £48, question 3, n = 73". The day a lender asks where your average spend comes from, you open the table instead of hunting for a justification.
Open answers are handled separately: list them all, group them by theme ("opening hours", "price", "welcome") and count each theme. With several hundred responses, AI can do that first grouping for you, as long as you check each theme against the original answers: it is one of the steps in our method for running market research with AI without letting it invent figures. These verbatims feed your sales pitch, not your forecast.
Once your assumptions are set, SeedAngels takes them as they are: you enter the population, the share of buyers, the frequency and the average spend, and the app builds the forecast and the business plan that follow from them.
Conclusion
A market research survey should be judged on a single column: the number each question produces. If a question leads neither to a share of customers, nor to a frequency, nor to an amount, nor to a price range, it has no place in your survey, however interesting it is.
Remember three rules. Ask about the past, not the future: what people bought, not what they would buy. Aim for at least 100 responses from people in your target, and more if you compare segments. Always discount purchase intent, and check the result against your capacity.
And keep in mind what a survey does not do: it measures demand, it does not prove that demand will pay. It complements interviews and commitments; it does not replace them. Take one of the three templates above, adapt the answer options to your sector, test it on five people: you will have your first quantified assumptions within two weeks.
Not sure about your target yet? The startup idea validator helps you frame the problem and the assumptions to test before you write your survey.
FAQ
How many questions should a market research survey have?
Between 12 and 15 questions, for a completion time under 10 minutes: every extra question costs you respondents, and long surveys get rushed. Start from the numbers your forecast needs (customers, frequency, spend, price): one question per number, one screening question, one consistency check and a few profile questions are enough.
How many people should you survey?
Aim for at least 100 responses from people in your target market: the margin of error is then about ±10 points. You need close to 400 to get down to ±5 points. If you compare several segments, each one has to reach that threshold. In B2B, when the target is small, a few dozen qualified responses can be enough.
What questions should you ask in a market research survey?
Questions about real, past behaviour: have you bought this type of product, how many times, how much did you pay, who from. Add two price questions (too expensive, too cheap to be credible) and a single intent question, at the end, which you will discount.
How do you ask about price in a survey?
Avoid “how much would you be willing to pay?”. First ask how much the person paid last time, then above which price the offer would be too expensive and below which price it would seem low quality. The acceptable price is the one the largest share of respondents finds neither too expensive nor too cheap.
Is a survey enough to validate a business idea?
No. A survey measures what people say; it sizes demand, it does not prove that demand will pay. Proof comes from commitment: a deposit, a pre-order, an accepted meeting. The survey complements the interviews and commitment tests described in our validation method.
Should you use open or closed questions?
Mostly closed, so you can count: frequencies, amounts, choices between options. Keep one or two open questions (what would make you switch provider, what is missing today) to understand motivations; they feed your sales pitch, not your numbers.
Does GDPR apply to a market research survey?
Not if it is truly anonymous, meaning no respondent can be re-identified. As soon as you collect an email address or a name to contact respondents again, you must inform them at the time of collection, including: who you are, why you collect the data, how long you keep it, how they can exercise their rights and their right to complain to the data protection authority. Make that field optional.