"Where does that number come from?"
The question lands within three minutes of your market slide, and your answer carries more weight than the number on it. An investor who knows your sector will test your order of magnitude against their own; one who does not will judge your reasoning. You do not get to choose which one sits across the table. All you can do is make sure your TAM survives both.
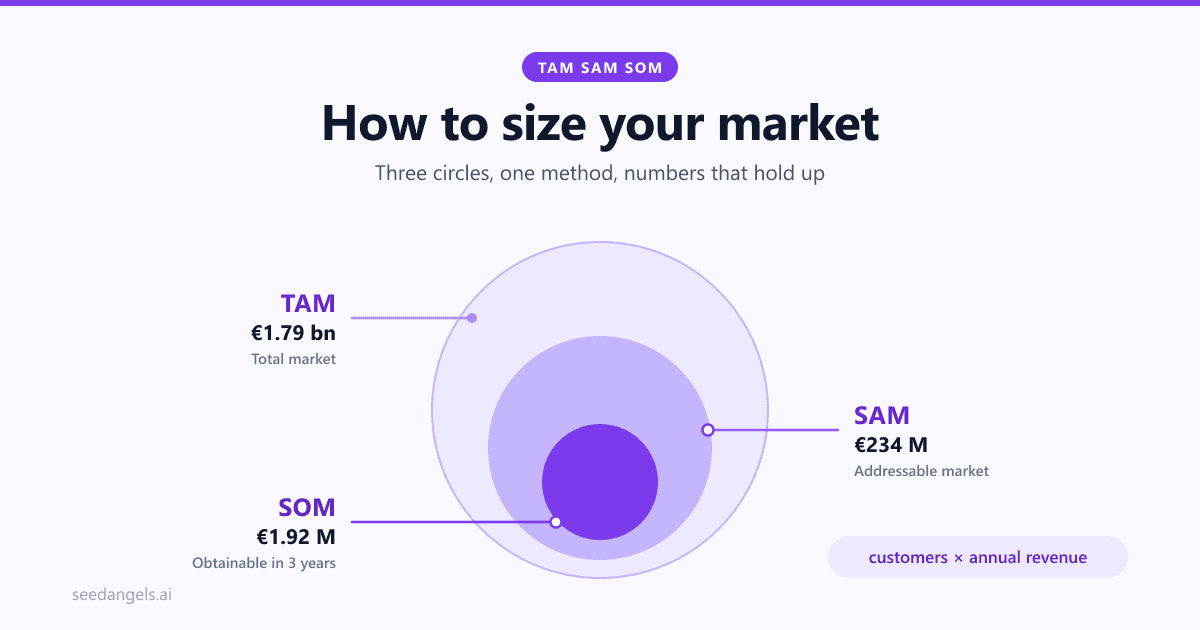
Three acronyms structure this exercise (TAM, SAM and SOM), describing three nested circles: the total market, the share you can address, and what you can realistically capture. Learning what they stand for takes thirty seconds. Producing a market size nobody can dismantle takes half a day, and that half day is what changes the outcome of a meeting.
There is less room for approximation than there used to be. In France, one of Europe's most active startup markets, KPMG's Tech Insights barometer recorded 194 funding rounds in 2024, against 287 in 2023, a 32 % drop in deal count. Fewer deals signed means files challenged harder, and market sizing is one of the first places anyone starts digging.
This guide walks through the full method, with a worked example you can replay from free public data, figures you can open, verify and adapt to your own business.
TAM, SAM, SOM: definitions
TAM (Total Addressable Market) measures the annual revenue you would generate by capturing 100 % of demand for your product category. SAM (Serviceable Addressable Market) is the share of that total your offering, your geography and your channels can actually reach. SOM (Serviceable Obtainable Market) is what you can reasonably capture within three years.
| Acronym | Full name | The question it answers | Order of magnitude |
|---|---|---|---|
| TAM | Total Addressable Market | How many possible buyers, and at what price? | The widest |
| SAM | Serviceable Addressable Market | How many of them are within my reach today? | 10 to 30 % of TAM |
| SOM | Serviceable Obtainable Market | What share will I convert within three years? | Often under 5 % of SAM |
These three numbers answer different questions, which is exactly why investors ask for them together. TAM says whether the opportunity is worth a fund's attention. SAM says whether you understand your own positioning. SOM says whether you know what your resources allow, and that percentage is observed at the end of the calculation: it is never set at the start.
The orders of magnitude in the table are observed benchmarks, not rules. Their use is to flag an anomaly: a SAM at 90 % of TAM signals that no filtering happened, a SOM at 30 % of SAM signals a market share capture nobody achieves in three years.
The two calculation methods: top-down and bottom-up
There are two ways to reach a TAM, and they do not carry the same evidential weight.
The top-down method (and why it is not enough)
The top-down method starts from a published headline figure (a sector study, an analyst report), then applies successive filters to narrow down to your market. "The European business software market is worth X billion, our country represents 15 %, my segment 8 %, therefore my TAM is…"
It has one merit: it situates your business inside a recognised whole.
Its flaw is in the chain of percentages. Some filters are documented, such as one country's share of a European market or the breakdown of a business population by company size. Others are assumed: "my segment represents 8 %" often rests on nothing but intuition. The final result no longer shows which is which. So display the source behind each filter, or say plainly that it is an assumption.
One limitation remains that rigour cannot fix: the result shows you can read a sector study, not that you know your customers.
It is also the shortest path to the sentence that kills a meeting: "we only need to take 1 % of this market." That phrase is investors' number one red flag, because it demonstrates no path, just a division.
The bottom-up method (the one that convinces)
The bottom-up method starts from the basic unit of your business: one customer, and what they pay you.
TAM = number of potential customers × average annual revenue per customer
That is the formula to remember. It forces you to answer two questions top-down lets you avoid: exactly how many companies or people match my target customer profile? and how much will each pay me per year? Answering the first requires an ideal customer profile precise enough to be counted. Answering the second requires a price, or at least a defensible range. Be careful not to conflate the two exercises, though: this bottom-up TAM measures total potential, whereas your revenue forecast starts from your real production and sales capacity over the year.
That is precisely why it convinces: it demonstrates operational understanding. A founder who can say "there are 39,000 companies matching my target profile, and they will pay an average of €6,000 per year" has done work that can be checked. A founder announcing "1 % of a €20 bn market" has made no falsifiable assumption at all. Average revenue per customer remains the weaker of the two terms, though, and the only one field work can settle: validating your idea with real customers gives you a price someone has actually accepted, which beats a rate observed at a competitor whose discounts you cannot see.
Triangulate without blending
Best practice is to calculate both, then compare. Top-down serves as a plausibility check on bottom-up, and vice versa.
Compare the two results. If they are close, keep the bottom-up figure as the one you display. If they diverge, check first whether the scope or the reference year differs between them: a European figure against a national one, 2021 data against 2023 data, a segment counted in one and not the other. If that difference in scope explains the gap, say so. If it does not, one of the two assumptions is wrong: on the top-down side, look for the percentage with no source; on the bottom-up side, the average revenue per customer or a count that is too broad.
Never average the two results. An average between a constructed figure and an approximate one no longer belongs to any method: you lose the ability to answer the question this guide opened with, where does that number come from.
Where to find market data for free
This is the most common sticking point: the method is clear, but where do you find the number of potential customers? Most of it is public and free.
| Source | What you find there | Access |
|---|---|---|
| Eurostat: structural business statistics | Number of enterprises by size class and industry, employment, value added across the EU | Free |
| National statistics offices | The same breakdowns at country level, usually more recent and more granular | Free |
| US Census Bureau: Statistics of U.S. Businesses | Number of firms and establishments by industry and enterprise size, employment, annual payroll | Free |
| Trade associations | Sector figures, number of establishments; granular detail is sometimes members-only | Varies |
| Published competitor accounts | Revenue by segment; average revenue per customer where the sector discloses it (telecoms, subscriptions) | Free |
| Paid studies (Gartner, Statista, sector analysts) | Fine-grained segmentation, growth forecasts, market shares | Paid |
| Customer interviews | Accepted price, real budget, decision cycle | Free, costs time |
Two points deserve attention before you use any of these.
Date every figure, and cite it. A sector study often lags reality by twelve to eighteen months, and an investor who knows your market knows that. Writing "33.1 million enterprises (Eurostat, 2023 business economy data)" protects you; writing "over 30 million companies" exposes you to the one question you will not be able to answer: where does that number come from? The rule counts double for a figure a chatbot gave you: AI market research only holds up if every number is traced back to its primary source before you copy it.
Only buy a study if it unblocks a decision. For market sizing at national or European scale, public statistics and a handful of customer interviews are enough in the vast majority of cases. This quantitative work is the numerical core of the market research in your business plan: the qualitative part describes needs and competitors, this part measures how much they are worth.
A full worked example: TAM, SAM and SOM end to end
Let us take a concrete case and run it all the way through: a B2B SaaS management tool sold to small and mid-sized companies in Europe, priced at €500 per month, which is €6,000 per year per customer. Every figure below can be recalculated.
Step 1: the TAM
Starting point: Eurostat's structural business statistics overview, which counts 33.1 million enterprises in the EU business economy in 2023. Of those, 99.1 % are micro enterprises (fewer than 10 employees), SMEs of all sizes represent 99.8 %, and large enterprises 0.2 %.
A €500-per-month management tool is not sold to micro enterprises. Applying the published shares to the 33.1 million total gives roughly 232,000 small and medium enterprises with 10 to 249 employees and 66,000 large enterprises:
232,000 SMEs + 66,000 large enterprises = 298,000 companies
298,000 × €6,000 = €1,788,000,000, or roughly €1.79 bn of TAM
Under two billion euros. Not a spectacular number, but every component of it is verifiable, and that is exactly what makes it usable.
Step 2: the SAM
SAM applies your real constraints. Three named filters, each with its justification:
- Industry filter: the product is built for business services and wholesale trade; heavy industry and construction have management needs the product does not cover.
- Size filter: the offering is calibrated for 20 to 249 employees; below that the need does not exist, above it the sales cycle exceeds our current capacity.
- Geographic filter: five countries at launch, where we have local-language support.
After all three filters are applied, the count falls to 39,000 companies:
39,000 × €6,000 = €234,000,000, or €234 M of SAM
That is 13.1 % of the TAM, a ratio consistent with three serious filters having been applied. Note that each filter is a sentence you must be able to defend, not a percentage pulled out of thin air.
Step 3: the SOM
This is where most files go off the rails, by writing "3 % of the SAM" with no justification. Build from your real commercial capacity instead, the same discipline as grounding a projection in your actual metrics rather than in an ambition.
Assumptions: a team growing from 4 to 8 sales reps over three years, a quota of 2 signatures per rep per month at full ramp, and 10 % annual churn.
| Year | New customers signed | Churn | Customer base at year end | Annual recurring revenue |
|---|---|---|---|---|
| Year 1 | 50 | 0 | 50 | €300,000 |
| Year 2 | 110 | −5 | 155 | €930,000 |
| Year 3 | 180 | −15 | 320 | €1,920,000 |
Three-year SOM = 320 customers × €6,000 = €1,920,000
As a share of the SAM, that is 0.82 %. This percentage was never a starting point: it is the output of the calculation. And that is what makes it defensible: you can explain every row of the table, which no "3 % of the market" ever allows.
Step 4: reconciliation
The final step, the one almost nobody does, and the first consistency check an investor runs on a complete file: your three-year SOM must match the year 3 revenue in your financial forecast.
Here, €1.92 M of recurring revenue at the end of year 3. If your forecast announces €8 M at the same horizon, one of the two documents is wrong, and you will not know which one to defend in the meeting. Three years is the standard planning horizon investors have in mind, which is also why this convergence is what guarantees consistency with your financials slide, where the same figure reappears in another form.
You can reuse exactly this structure (TAM, SAM, SOM, then reconciliation with the projections) in a business plan built with SeedAngels, where market size and financial forecast live in the same document.
The counting trap: "all companies" is never your market
Here is the most common mistake in market sizing, and it fits in one line: counting the entire enterprise population as potential customers.
The statistics settle the debate. According to the same Eurostat structural business statistics, micro enterprises make up 99.1 % of EU enterprises but generate only around 19.6 % of value added. In other words: the overwhelming majority of European companies, by count, accounts for roughly a fifth of economic activity. A tool priced at €300 or €500 per month has no market in that population: the need does not exist at that scale, and the budget even less so.
The rule: filter by ability to pay, not merely by existence. A company enters your count only if it has the need, the budget and the decision-making authority. Three conditions, not one.
One methodological detail is worth owning rather than hiding. Different official sources give different totals for the same continent: Eurostat's news release on micro and small businesses counts 32.3 million enterprises for 2022, while the structural business statistics overview counts 33.1 million for 2023. They do not contradict each other, the scopes and reference years differ. This is the best possible illustration of a principle: a market figure does not exist without its scope. If you cannot state what scope your number covers, you do not have a number, you have an order of magnitude.
The same discipline applies wherever you are counting. In the United States, the Census Bureau's Statistics of U.S. Businesses publishes firm and establishment counts by industry and enterprise size for free, the equivalent starting point, with its own scope to state explicitly.
This filtering sometimes delivers bad news: the genuinely solvent market turns out to be far narrower than expected. That is valuable information, and it should surface early, which is exactly what validating your startup idea is for, before you invest six months of development.
A B2C example: when your customers are consumers
The reasoning changes material but not logic. You replace the enterprise base with a population, and revenue per customer with an average annual basket.
Take a mobile budgeting app at €4 per month, so €48 per year, targeting urban working adults aged 25 to 44, launching in a single mid-sized European country.
- Starting population: the 25 to 44 age band, from the national statistics office's population pyramid: roughly 16 million people.
- Activity filter: around 88 % of that age band is employed or actively looking (labour force survey), so roughly 14.1 million people.
- Urban filter: around 80 % of the population lives in an urban area (national urban-area classification), so roughly 11.3 million people in the target segment.
- Segment TAM: 11,300,000 × €48 = €542,400,000.
- Realistic penetration rate: 2 % of the segment over three years, so 226,000 paying subscribers.
- SOM: 226,000 × €48 = €10,848,000.
Everything hinges on the penetration step. That is where fanciful B2C TAMs hide: one extra penetration point nearly doubles the result, and nothing in the arithmetic signals that the assumption is wrong. A penetration rate is not set by intuition: it is derived from the acquisition cost you can afford, the conversion rate observed in your first campaigns, or the penetration a comparable player reached in the same segment.
One additional precaution in B2C: distinguish the user from the payer. An app with 500,000 free users and a 2 % conversion rate does not have a market of 500,000 people, it has 10,000 customers. That distinction between a user segment and a solvent customer segment is exactly what a business model canvas clarifies, and it is better settled before you calculate than in front of an investor.
The classic mistake: an inflated TAM, and how to fix it
Nothing beats a counter-example. Here is the calculation as it appears in every other pitch, followed by the same market sized properly.
Before: the inflated calculation
"The global business software market is worth $200 bn. We are targeting 1 % of that market, a $2 bn potential."
Three reasons an investor rejects this reasoning, in the order they occur to them:
- The scope is not yours. "Business software" aggregates multi-million-euro ERP systems, vertical industry tools and consumer applications. You do not compete in all of those segments simultaneously, and you do not sell in 190 countries.
- The "1 %" is not an assumption, it is a wish. No path connects your current team to $2 bn in revenue. The figure commits to nothing, so it demonstrates nothing.
- The figure cannot be verified. With no dated source and no explicit scope, the person across the table cannot check it, and what they cannot check, they discard.
After: the same market, sized properly
"Our target customer is a European company of 20 to 249 employees in business services and wholesale trade. Eurostat counts 33.1 million enterprises in the EU business economy in 2023, of which 0.9 % are non-micro; after industry, size and geographic filtering, our addressable market is 39,000 companies. At €6,000 per year, that is a SAM of €234 M. Our commercial capacity supports a target of 320 customers in three years, or €1.92 M in recurring revenue."
The second figure is a thousand times smaller than the first. It is also the only one of the two that inspires confidence, for a simple reason: it is falsifiable. An investor can contest a filter, debate the average revenue per customer, challenge the signing pace, and that discussion is exactly the one you want, because it is about your execution rather than your credibility.
How to present the market on your slide
Once the calculation is done, the slide becomes simple. A few rules are enough.
- One visual only: three concentric circles, or three numbers side by side. Nothing else. All three amounts must be readable from the back of a room.
- One method sentence under the numbers: "bottom-up: 39,000 companies × €6,000/year". That single line is what sets your slide apart from every other one.
- Sources at the bottom of the slide, with their date: "Eurostat, business economy 2023". Small type, but present.
- A SOM consistent with your forecast: the number on the market slide and the one on the financials slide must be the same number.
- No market growth curve on this slide: a sector report's compound growth rate adds nothing to your demonstration, and it invites questions about a source you do not control.
The bar moves with your stage. At pre-seed, a clean method and owned assumptions are enough. At Series A, your SOM will be expected to be corroborated by observed figures: real conversion rate, real average basket, real acquisition cost. This is one of the dimensions where the level of proof expected at your stage shifts most sharply from one round to the next. The slide itself sits naturally within the market slide of your pitch deck, right after the problem and the solution.
One last point, counter-intuitive but consistent: a narrow but demonstrated TAM, paired with a credible expansion path, is stronger than a giant unsupported one. If your initial market is €234 M but you can explain how it reaches €900 M by opening two adjacent segments, you are telling a trajectory. If your market is $20 bn with no method, you are telling nothing.
FAQ
What do TAM, SAM and SOM mean?
TAM (Total Addressable Market) is the total market if you captured 100 % of demand. SAM (Serviceable Addressable Market) is the share your offering and your distribution can realistically address. SOM (Serviceable Obtainable Market) is what you can reasonably capture within three years, given your actual resources.
How do you calculate your TAM?
The bottom-up method, the most convincing one, multiplies the number of potential customers by the expected average annual revenue per customer. The top-down method starts from a published market study and applies successive filters. Calculate both ways and compare the order of magnitude: a wide gap that scope does not explain reveals a faulty assumption.
What is the difference between TAM and SAM?
TAM ignores your constraints: it measures the entire market, across all geographies and all segments. SAM applies your real limits: the territory you cover, the customer segments you target, the distribution channels available to you, your price positioning. Moving from TAM to SAM must be justified by named filters, not by an arbitrary percentage.
What percentage of the SAM should the SOM be?
Do not start from a percentage. Build the SOM from your real capacity: number of sales reps, quota per rep, sales cycle, acquisition budget. Expressed as a share of the SAM, the result frequently lands below 5 % over three years, but that is a consequence of the calculation, never its starting point.
Where can you find reliable market data for free?
National statistics offices publish enterprise counts by size class and industry at no cost: Eurostat and the EU structural business statistics in Europe, the Census Bureau's Statistics of U.S. Businesses in the United States. Add trade associations, the published accounts of listed competitors, and your own customer interviews. Date every source: sector studies often lag reality by twelve to eighteen months.
Do you need a multi-billion TAM to raise funds?
No. A modest but rigorously demonstrated TAM, paired with a credible expansion path, inspires more confidence than a multi-billion market asserted without method. Investors assess your reasoning as much as the number itself. That said, a market too narrow to absorb the return a fund needs remains a genuine obstacle.
Should the SOM match the financial forecast?
Yes, without exception. Your three-year SOM and the year 3 revenue in your forecast must converge. A divergence means one of the two is wrong, and it is one of the first consistency checks an investor runs when reading a complete file.
Conclusion
Market sizing is not a communication exercise, it is an exercise in traceability. Every euro of your TAM must be traceable back to a count and a price: how many customers, at what rate, under which filtering conditions. That path, not the size of the result, is what makes a number defensible.
Three habits are enough to hold that standard. Calculate bottom-up and use top-down as a check, never the other way round. Filter by ability to pay rather than by existence: 33 million European enterprises are not 33 million customers. And verify that your three-year SOM lands on the year 3 revenue in your forecast: that is the test you will be put through, so you may as well run it at home first.
Pull up your market slide now and ask it a single question: could a reader who does not know your industry redo the calculation from what is displayed? If the answer is no, the slide is not what needs reworking, it is the calculation behind it.
To build that market size and the forecast it has to match inside one document, SeedAngels runs the two together and flags inconsistencies along the way. Try SeedAngels for free →