What your market research has to produce
Your lender will not read twenty pages of market research: they will look for four numbers, and they will ask where those numbers come from. How many potential customers, how often they buy, how much they spend, and what share you expect to win. If those four numbers have no source and no date, the rest of the plan does not stand, however polished the layout.
The SBA puts it plainly: lenders and investors commonly request a traditional business plan, and its market analysis section requires "a good understanding of your industry outlook and target market." Yet most guides stop exactly where the research should start producing numbers. They list the headings (market, competition, customers, trends) and leave you alone with the line that matters: first-year revenue.
This article follows a single example all the way through: a lunch restaurant in an office district. Every research finding becomes a dated, sourced assumption, then a line of the forecast. By the end, you will have a copyable assumptions table and a first-year revenue figure you can defend.
What is market research in a business plan?
Market research for a business plan is the analysis of demand, competition and the business environment, carried out to estimate how many customers will buy, at what price and how often. In a business plan, its job is to justify every assumption behind the revenue forecast.
The SBA describes market research as blending "consumer behavior and economic trends to confirm and improve your business idea," and frames it as a short set of questions:
- Demand: is there a desire for your product or service?
- Market size: how many people would be interested in your offering?
- Economic indicators: what is the income range and employment rate?
- Location: where do your customers live and where can your business reach?
- Market saturation: how many similar options are already available?
- Pricing: what do potential customers pay for these alternatives?
Market research answers "does this market exist, and how much is it worth to me?". A feasibility study answers a different question, "can I actually serve it?", and we have covered how it differs from a feasibility study and in which order to run the two.
Is it required?
Not legally, but in practice yes. No regulation requires market research to start a business or to apply for a loan. But a lender, an SBA-backed loan officer or an angel investor will not ask "did you do market research?". They will ask "where does this revenue number come from?", and market research is the only acceptable answer.
That is why a business plan without a market section rarely gets past the first meeting. What funders check, precisely, is covered further down in What lenders and investors check.
The 6-part market research outline
A useful market research outline follows the order in which a funder asks questions. Each part has to deliver something specific:
- The market and its trend. Its size and recent direction, with dated figures. Deliverable: an order of magnitude and a direction (growing, flat, shrinking). For the sizing itself, size the market with TAM, SAM and SOM, from the total market down to the share you can actually reach.
- Demand. Who your customers are, how many there are, how often they buy and what they spend. Deliverable: three numbers (count, frequency, ticket).
- Competition. Direct and indirect competitors, their prices, their strengths. Deliverable: a price survey and a competitor count. The full positioning work belongs to the competitive analysis grid; there is no need to redo it here.
- The environment. Regulation that applies to you, consumer trends, technology shifts. A PESTEL checklist is enough to avoid blind spots. Deliverable: the two or three factors that change your assumptions.
- Location (for a local business). The area your customers will come from, foot and car traffic, access. Deliverable: a mapped trade area and the number of customers inside it.
- The summary. The numbers that go into the forecast, each with its source and date. Deliverable: the assumptions table shown further down.
The outline, ready to paste into your document:
MARKET RESEARCH — [Project name] — version of [date]

1. The market and its trend
   - Market size (source, year)
   - 3-to-5-year trend (source, year)
2. Demand
   - Target customer profile
   - Number of potential customers in the area (source, year)
   - Purchase frequency (survey: date, number of responses)
   - Budget / average ticket, before and after tax
3. Competition
   - Direct and indirect competitors (count, source)
   - Price survey (date)
4. Environment
   - Applicable regulation
   - Trends that change demand
5. Location (local business)
   - Trade area map
   - Traffic, access, site
6. Summary: the forecast assumptions
   - Table: finding / source and date / assumption / forecast line
   - Low case and base case

Appendix: raw survey, interview notes, data extracts
How to do market research: sources and methods
Market research follows a set order: existing sources first (secondary research, or desk research), then the field (primary research). Secondary research gives you, for free, the size of the population, the number of competitors and the trends in your industry. Primary research (interviews, surveys, observation) gives you what no statistic can: how customers in your area react to your offer. Starting with the field means asking questions whose answers already existed.
Qualitative or quantitative: what each one is for
The two approaches answer different questions, and a business plan needs both, in this order.
| Qualitative | Quantitative | |
|---|---|---|
| Question asked | Why? How? | How many? How often? |
| Method | One-on-one interviews, observation | Survey, counts |
| Typical sample | About ten people | Several dozen to several hundred |
| What it gives the business plan | The need, the objections, customers' words | The numbers: frequency, budget, share interested |
Qualitative work helps you phrase the questions; quantitative work measures. A survey written without interviews first asks the founder's questions, not the customer's. For the interviews, follow the interview protocol to validate an idea: it keeps you away from leading questions and free compliments.
The free data that is enough for a local business
For a store, a restaurant or a local service, four free sources cover most of what you need:
- Census Business Builder, which packages Census Bureau population and economic statistics (residents, households, income, businesses) in an accessible format, area by area.
- OnTheMap, one of the Census Bureau's LEHD applications, which shows "where workers are employed and where they live." For a business that serves office workers, jobs at the workplace matter more than residents.
- County Business Patterns, the annual count of establishments with paid employees by industry (latest data: 2023), also published by ZIP code (ZIP Codes Business Patterns), which is closer to a walkable trade area. NAICS 7225 covers restaurants and other eating places.
- The SBA's market research guide quoted above, which lists the other free federal sources (Bureau of Labor Statistics, Bureau of Economic Analysis) by type of question.
For broader research (a startup, a national market), the full list of sources is in our TAM, SAM, SOM guide. And if you want to speed up this desk research phase, you can use AI for market research, and check every figure at its source: AI speeds up collection, but it still invents statistics with total confidence.
The worked example: a lunch restaurant
The project: a 45-seat lunch restaurant in the office district of a mid-sized city. Lunch service only, open 5 days a week, 46 weeks a year, so 230 trading days. A lunch special around $15 before tax, no alcohol. The founder is preparing a bank loan application.
Every figure specific to this restaurant (number of office workers, frequency, capture rate) is an assumption of the example, not a national average. Only figures attributed to a public source are statistics.
Each finding follows the same template: what we are looking for, where we find it, what we found, and the assumption we keep. The repetition is deliberate: it is exactly what a lender needs to be able to re-read.
Finding 1: how many potential customers?
What we are looking for. A lunch restaurant in an office district does not live off residents but off the people who work a few minutes away on foot. The target is everyone working within roughly a 7-minute walk.
Where we find it. OnTheMap lets you draw an area and see how many jobs it contains. City-wide figures are far too broad: you need the blocks around your site, cross-checked with the headcount of the main employers nearby.
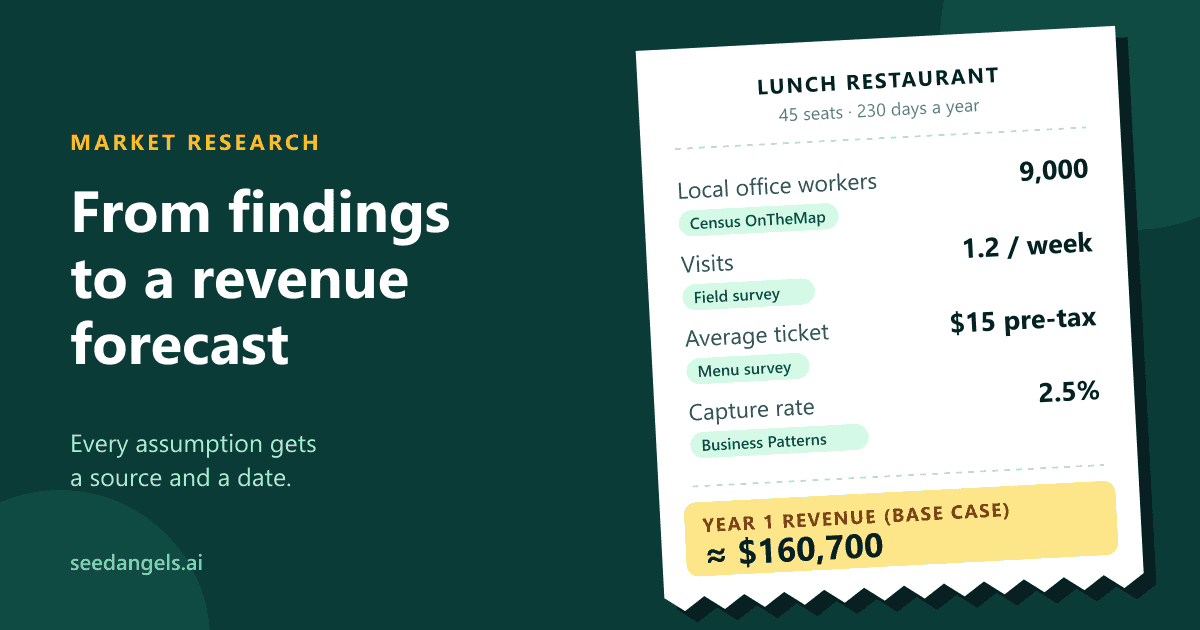
What we found. In the example, the area drawn around the site contains about 9,000 jobs.
Assumption kept: 9,000 office workers in the area.
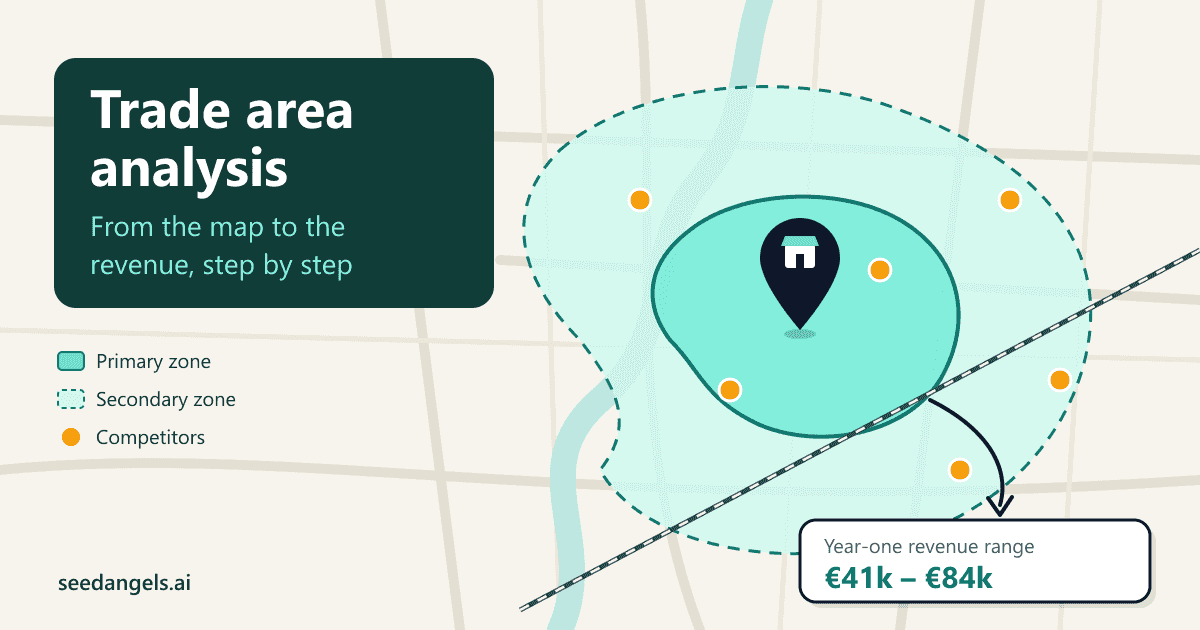
Everything here depends on the boundary: too wide and you inflate your customer base, too tight and you crush it. The method to run a trade area analysis (travel time, physical barriers, customers who spend elsewhere) deserves its own piece of work.
Finding 2: how often do they buy?
What we are looking for. How many times a week an office worker in the area buys lunch at a restaurant (rather than a cafeteria, a packed lunch or a grocery sandwich).
Where we find it. No public statistic gives this figure for your neighborhood. Two field sources: a survey of office workers in the area, and watching the lunch lines at competitors. The national context calls for caution: according to the Bureau of Labor Statistics, average household spending on food away from home was $3,945 in 2024, essentially flat from $3,933 in 2023. Eating out is not a growing habit you can count on.
What we found. Respondents report eating lunch at a restaurant 1.5 times a week on average.
The discount. A stated intention is not a purchase: people overstate how often they will do things. We apply a 20% discount to the stated frequency.
Assumption kept: 1.2 lunches per week per office worker. Low case: 0.96 (a further 20% discount).
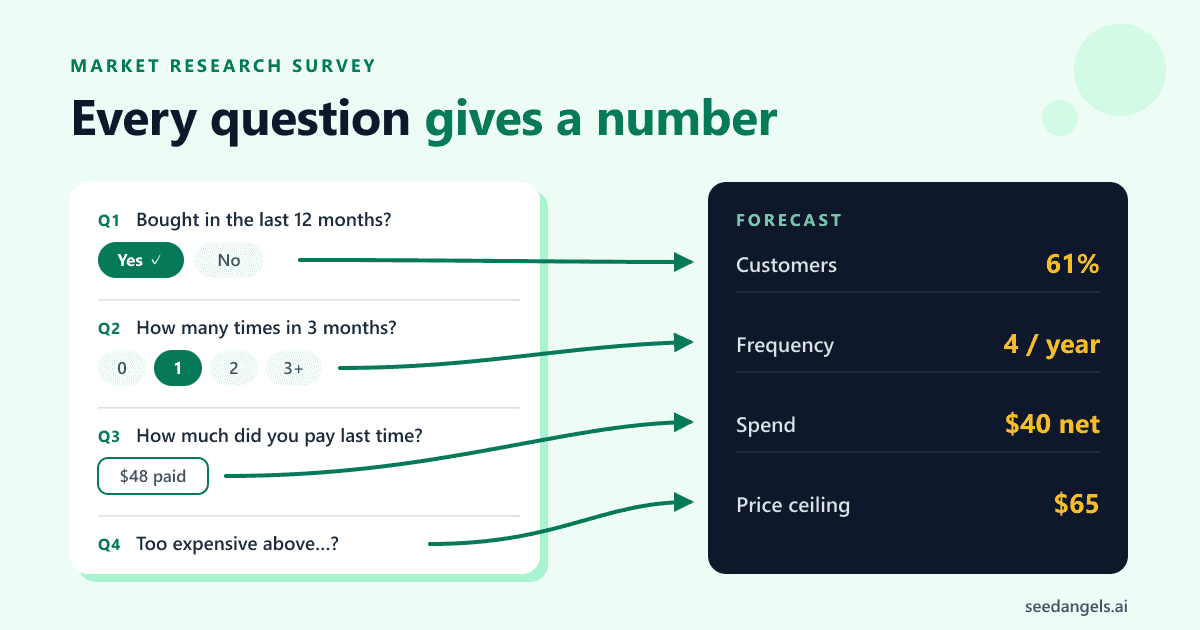
The quality of this number depends entirely on how the question was asked. "Would you come to lunch at our place?" produces a polite yes; "How many times did you eat lunch at a restaurant last week?" produces a behavior. We have gathered the market research survey questions that turn into forecast numbers, with their exact wording.
Finding 3: what average ticket, before tax?
What we are looking for. The average amount spent per customer, as it will appear in your income statement.
Where we find it. A survey of the menus of 10 to 12 competitors in the area, dated, noting the price of the lunch special and of single dishes.
What we found. Lunch specials in the area range from $13 to $18. The restaurant positions itself in the middle, at $15.
The sales tax trap. Sales tax collected at the register is not revenue: you hold it for the state and local authorities and pay it over. Tips are not revenue either. If your survey asked people what they "usually spend on lunch," their answer probably includes tax and tip, and has to be brought back to the menu price before it enters the forecast.
Assumption kept: average ticket of $15 before tax.
Finding 4: what share can you capture?
What we are looking for. The share of the area's restaurant lunches that will come to you rather than to a competitor.
Where we find it. A count of places that serve lunch in the area: County Business Patterns, or its ZIP-code version (ZIP Codes Business Patterns), gives a first count of restaurants (NAICS 7225), to be checked on foot, since recent openings and closures do not always show up in databases.
What we found. 30 places serve lunch in the area. A new entrant performing like the average would win a "fair share" of 1 in 31, about 3.2%.
The reasoning. A new entrant has no customer base, no reputation and no habits working for it: it starts below average. So we keep a rate well below the fair share, roughly three quarters of it: a prudence choice to justify in the plan, not an industry norm. Once the ramp-up is applied, the average first-year capture comes out at about 2.2%, within the 1 to 3% range we most often see in first-year plans.
Assumption kept: 2.5% of the area's restaurant lunches at cruising speed. Low case: 2%.
The capacity check
The demand you calculate has to fit in the dining room. Skipping this check is a classic forecasting mistake: demand that exceeds your seats is not revenue.
Capacity: 45 seats × 1.4 table turns at lunch = 63 covers a day at most
Demand: 9,000 workers × 1.2 lunches × 2.5% = 270 covers a week, so 270 / 5 = 54 covers a day
Demand fills 86% of capacity. That is plausible, but tight: one rainy day or a busy Friday is enough to fill the room, and 1.4 turns assumes fast service. Write it in the plan rather than hoping nobody does the math. Had demand exceeded capacity, capacity would have been the number to keep.
From finding to assumption: the table that links research to forecast
To turn market research into a revenue forecast, convert each finding into a sourced, dated assumption, then assign each assumption to a line of the forecast. The resulting table is the centerpiece of your market section. From there, each assumption flows into the three statements of a complete financial forecast: price and frequency into the income statement, payment terms into the cash flow plan.
| Research finding | Source and date | Assumption kept | Forecast line |
|---|---|---|---|
| Office workers in the area | Census OnTheMap (jobs at workplace, year) | 9,000 | Customer base |
| Stated frequency 1.5/week | Survey of local office workers (date it) | 1.2/week (discounted −20%); low: 0.96 | Volume |
| 30 competitors at lunch | ZIP Codes Business Patterns + walk-through (date it) | Capture 2.5% (low: 2%) | Volume |
| Competitor prices $13–18 | Menu survey (date it) | $15 before tax | Average ticket |
| 45 seats, 1.4 turns | Floor plan | Ceiling of 63 covers/day | Check |
| Ramp-up | Prudent assumption | 60% (M1–3), 85% (M4–6), 100% (M7–12) | Year 1 seasonality |
The "Source and date" column is the golden rule. An assumption without a date is an opinion: a lender who reads "menu survey, March 2026" knows what they can check; a lender who reads "market prices" knows nothing.
The calculation, step by step:
Full run rate: 54 covers × 230 days = 12,420 covers × $15 = $186,300
Ramp-up: (3 × 60% + 3 × 85% + 6 × 100%) / 12 = 86.25% on average over the year
Year 1, base case: $186,300 × 86.25% = about $160,700
Year 1, low case (frequency 0.96, capture 2%): 9,000 × 0.96 × 2% = 172.8 covers a week, so 34.6 a day × 230 days = 7,949 covers × $15 = $119,200 × 86.25% = about $102,800
Month by month, the first year reads like this:
| Period | Load | Base case ($ / month) | Low case ($ / month) |
|---|---|---|---|
| Months 1 to 3 | 60% | 9,320 | 5,960 |
| Months 4 to 6 | 85% | 13,200 | 8,450 |
| Months 7 to 12 | 100% | 15,530 | 9,940 |
| Year 1 | ≈ 160,700 | ≈ 102,800 |
This smoothing spreads the 46 trading weeks evenly across the year; in the real forecast, put the closed weeks where they actually fall (summer, year-end holidays), because they dig into that month's cash.
The range from $102,800 to $160,700 comes from just two levers: frequency and capture rate. That range is what you present, not a single number. The base case is what you build the plan on; the low case is what you use to check that cash holds.
This is a demand-based calculation. Before it goes into the plan, cross-check it against the other revenue forecast methods, capacity-based and comparables-based: if they give a very different result, one of your assumptions needs another look.
6 mistakes that break the link between research and forecast
Six classic mistakes turn market research into wishful thinking. Applied to the restaurant, they become very concrete:
- Starting from the revenue you need to cover your costs. "I need $165,000 to pay rent and two employees, so I'll make $165,000": the market does not know your rent.
- Working back from the profit you want. The same mistake from the other end: you adjust the capture rate until the result looks right.
- Copying figures from another area without adapting them. Lunch traffic in a big-city financial district says nothing about a mid-sized city.
- Forgetting seasonality. An office-district restaurant loses a large share of its customers during summer vacations and holiday weeks: July does not look like October.
- Counting sales tax or tips as revenue. Both pass through your register; neither belongs to you.
- Ignoring real capacity. Demand of 80 covers a day in a room that serves 63 is not revenue, it is a line out the door.
All six share the same flaw: the number comes before the research instead of out of it.
What lenders and investors check
A lender, looking at a small business, reads the market section with one question in mind: is first-year revenue solid enough to repay the loan? In practice, they check:
- that each of the four assumptions (customers, frequency, ticket, capture) has a source and a date;
- that the average ticket excludes sales tax;
- that calculated demand fits within the site's capacity;
- that a low case exists, and that cash stays positive under it;
- that the data is local and recent, not national or borrowed from another project;
- that first-year ramp-up is gradual.
Revenue is only the first step of their review. Next come the ratios a lender runs on your forecast: owner equity, debt service coverage, the lowest cash month.
An investor, looking at a startup, asks the same question at a different scale. They check that the reachable market (the SOM) is consistent with year-3 revenue, that revenue is built bottom-up (customers × price) rather than as a percentage of a giant market, and that competitors are named rather than declared nonexistent.
Writing the market analysis section of your business plan
In the business plan, the market section is not the research itself: it is its summary. For a local business, two to four pages are enough.
In the body of the plan, keep:
- a five-to-ten-line summary: the market, its trend, the target and the conclusion (the market exists, and here is the share you aim for);
- the assumptions table, with its "Source and date" column;
- a trade area map, for a local business;
- a short competitor grid (name, price, positioning);
- the revenue calculation, base case and low case.
In the appendix, put everything that proves without weighing the plan down: the raw survey and its results, interview notes, Census extracts, photos of the menu survey. The lender may not read them, but they must be able to find them.
If you write the plan with SeedAngels, this market section is prepared for you from web research: market size (TAM, SAM, SOM) with the reasoning behind each figure, competitors, personas, and a Sources page that lists every page consulted. Two things stay yours: the fieldwork (survey, interviews, counts) and your revenue assumptions, which you validate yourself before the tool generates the forecast and the business plan.
Where to find a market research example
The most useful example is a complete business plan in your industry, because it shows how the market section connects to the forecast that follows. You can download the restaurant business plan example, which includes a written market section.
Use an example as a structural template, never as a source of numbers: lunch traffic in someone else's city says nothing about yours. Other industries (hotel, vacation rental, beauty salon, SaaS startup) are covered in our business plan templates.
Do it yourself or hire a research firm?
| Option | Indicative cost | Best for |
|---|---|---|
| Do it yourself | Mostly time; public data is free | Store, restaurant, small service business |
| SBA resource partners | Free or low-cost counseling (SCORE, SBDCs) | Founders who want an outside view and local knowledge |
| Research firm | Far higher, quoted per project | Large investment, wide quantitative survey |
For a store or a small business, doing your own market research, with help from SBA resource partners such as SCORE mentors and Small Business Development Centers, is enough in the vast majority of cases. It is not the cheap option: you will know your area better than anyone, and you are the one the lender will question about your assumptions. A study delivered by a firm that you cannot defend is worth less than a modest one where you own every number.
A firm makes sense when the stakes are high: an investment of several hundred thousand dollars, a site in an area you do not know, or a large quantitative survey you cannot run yourself. The same logic applies to a feasibility study: outsource what you cannot do, not what you need to understand.
Conclusion
Market research is not a decorative chapter placed before the numbers. It is the "source" column of your forecast: every revenue figure must be able to point back to it.
The method is a short chain. Four findings (customers, frequency, pre-tax ticket, capture rate), each sourced and dated. A capacity check. A base case to build the plan, a low case to test cash. For our restaurant, that chain turns a hunch ("the neighborhood needs a good lunch spot") into a range of $102,800 to $160,700 that any lender can recompute.
Keep one rule in mind: an assumption without a date is an opinion. Date everything, and your market research stops being a formality and becomes your strongest argument.
Turn your assumptions into a forecast and a complete business plan with SeedAngels, or test your project first with our free startup idea validator. Try SeedAngels for free →
FAQ
How do you do market research for a business plan?
Start with existing sources (Census data, a count of competitors, industry data), then go into the field with interviews and a survey. The goal is not an exhaustive report but four dated, sourced assumptions: number of potential customers, purchase frequency, average ticket before tax and the share of the market you can capture. Those four numbers drive your revenue forecast.
What should the market analysis section of a business plan include?
Six parts: the market and its trend, demand (who buys, how many, how often), the competition and its prices, the environment (regulation and trends), the location for a local business, and a summary listing the assumptions that feed the forecast. Raw material such as survey responses and data extracts goes in an appendix.
Do lenders require market research?
No law requires it, but the SBA notes that lenders and investors commonly request a traditional business plan, which includes a market analysis section. What they actually check is traceability: where each revenue assumption comes from and when it was collected. A forecast built on undated, unsourced numbers is the fastest way to lose a lender's trust.
How much does market research cost?
Done yourself, it mostly costs time: Census and Bureau of Labor Statistics data are free, and so is counting competitors and noting their prices. SBA resource partners such as SCORE and Small Business Development Centers offer free or low-cost counseling. A research firm costs far more, which mainly makes sense for a large investment or a wide quantitative survey.
What is the difference between qualitative and quantitative research?
Qualitative research, through interviews with about ten people, helps you understand the need, the objections and the words customers use. Quantitative research, through a survey of a larger sample, measures: purchase frequency, budget, share of interested respondents. For a business plan, start with qualitative work to ask the right questions, then use quantitative data for the numbers.
Where can I find a market research example for a business plan?
Industry business plan templates include a complete market section, like our downloadable restaurant example. Use it as a structural template, not as a source of numbers: figures observed in another city or neighborhood say nothing about yours. Your assumptions must come from your own trade area and carry a date.