What a trade area analysis must produce
You were told to "define your trade area". You drew a circle on Google Maps. Now what? Your lender will not ask for the map. They will ask where the revenue on the first line of your forecast comes from.
A trade area analysis has one job: turning a territory into a number. Most guides stop at the map. They explain primary zones and drive-time polygons, then say the trade area "helps estimate sales" without ever doing the sum.
This article does it end to end, on one business: a beauty salon opening in Auxerre, a town of 35,097 people in Burgundy, France. The example is French because every input in it is real, published public data that you can check yourself, and the French statistics office publishes exactly what the method needs. Each step also names the US equivalent, so the method transfers to any country with a census. Amounts stay in euros; the method works the same in any currency. At the end, you have a map, four sourced figures (target population, spending, competitors, capture rate) and a first-year revenue range you can defend line by line. It is the local, numbers-first part of the market research in your business plan.
Trade area: definition and the three zones
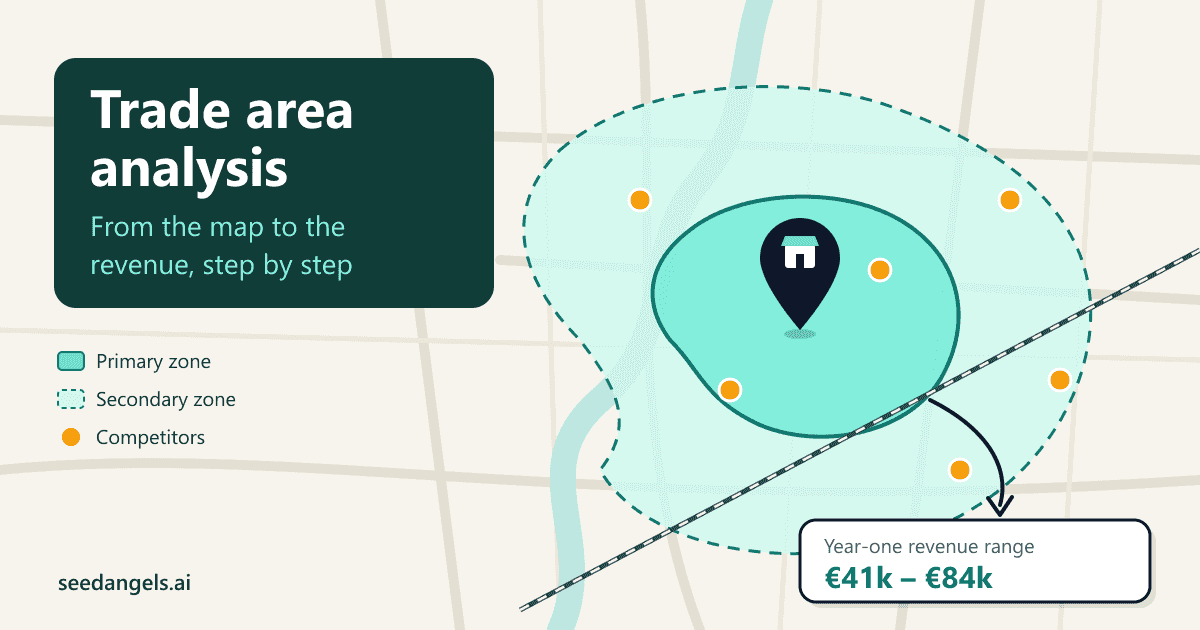
A trade area is the geographic area a store draws most of its customers from. It is measured in travel time rather than miles, split into three zones (primary, secondary, tertiary) by proximity, and it serves one precise purpose: counting potential customers to estimate the revenue the business can reach.
The University of Wisconsin–Madison Extension notes in its guide to trade area analysis that the area is most often drawn around the zip codes that account for about 75% of total customers.
| Zone | Indicative travel time (convenience) | Indicative travel time (destination) | What it represents | Weight in the calculation |
|---|---|---|---|---|
| Primary | 5–10 min walk | 10–15 min drive | The core, most loyal customers | Highest capture rate |
| Secondary | 10–15 min walk or 5–10 min drive | 15–30 min drive | Regular but less captive customers | Lower capture rate |
| Tertiary | Beyond | Beyond 30 min | Occasional, passing customers | Usually left out of the numbers |
These thresholds are starting conventions, not standards. A bakery and a day spa do not have the same trade area, and the street has the final word.
Radius ring or drive-time?
| Method | What it draws | When it misleads |
|---|---|---|
| Radius ring | A circle of fixed distance around the store (e.g. 1 mile) | Whenever a railway, highway, river or lack of parking cuts the circle |
| Drive-time / walk-time (isochrone) | The places that can reach the store within a given time on the real network (e.g. 10 min walk) | Rarely; this is the method to use |
Competition authorities reason the same way. In its decision 13-DCC-59 of 21 May 2013, the French competition authority recalls that supermarkets compete within 15 minutes of driving time and hypermarkets within 30 minutes. That is merger practice for large grocers, not a rule for your shop, but it confirms the principle: think in minutes, not miles.
The 6-step method
- Draw the primary and secondary zones with an isochrone, then correct them by hand.
- Count the target population of each zone from census data.
- Estimate the annual spending per target person in your category.
- List the active competitors in the zone and compute a density ratio.
- Apply leakage, then a justified capture rate, zone by zone.
- Check the result against your production capacity and a street test.
The running example: a two-room beauty salon run by its founder and one employee, opening in Auxerre's town centre. Each step ends with its application to this project.
Step 1: draw the zone with a free isochrone
Pick the travel time and mode
| Business | Dominant mode | Primary zone | Secondary zone |
|---|---|---|---|
| Bakery | Walking | 5 min | 10 min |
| Beauty salon | Car in a mid-size town, walking in a city | 10 min | 20 min |
| Neighbourhood restaurant | Walking | 5–7 min | 10–15 min |
| Destination restaurant | Car | 15 min | 30 min |
| Gym | Car or walking | 10 min | 15–20 min |
Treat these as starting points. Ask three established shop owners where their customers come from: their answer beats this table.
Draw the isochrone
The simplest free tool is openrouteservice, a mapping service built on OpenStreetMap that is free to use online (its free API allows 500 isochrones a day).
- Open the map and switch to "Isochrones".
- Drop the point on your premises' address.
- Choose the profile (walking, cycling, car) and the times: for example 10 and 20 minutes by car.
- Run it: two irregular outlines appear, one inside the other.
- Export or screenshot the result: this is the map that goes into your business plan.
Paid geomarketing software becomes worth it when you compare many sites, not for a single location.
Correct the map by hand
An isochrone only knows roads. Adjust it with what you see on site:
- Barriers: a railway with no nearby crossing, a highway, a river, an area with no parking. People on the other side are further than they look.
- Traffic generators: a station, a market, a high school, an office district, a hospital. They bring customers who do not live in the zone.
- Strong competitors: an established salon at the edge of your zone takes its fringe. Your zone often stops halfway.
Running example: the salon. Primary zone: 10 minutes by car from the town centre. Secondary zone: 20 minutes. To stay on published figures anyone can check, the example approximates these outlines with administrative boundaries: primary zone = the commune (town) of Auxerre, secondary zone = the 28 other communes of the Auxerrois agglomeration community (communauté d'agglomération). This is a declared simplification: with grid data (Step 2), you would follow your isochrone much more closely.
Step 2: count the target population
Census data for the zone
Every national statistics office publishes population by age and sex for each municipality. In the US, the Census Business Builder gathers selected Census demographic and economic data with interactive maps and downloadable reports for the area you select. In France, the INSEE "Dossier complet" of a commune gives the same tables: population by sex and age (POP T4), households, median living standard, jobs at place of work.
Add up the municipalities of your zone. If your isochrone cuts through them, use grid data: INSEE publishes Filosofi 2021 grid data in 200 m squares (released 16 February 2026), and US census block groups play the same role. Small cells include imputed values, so read them as orders of magnitude. The grid has no split by sex and its age bands jump from 11–17 to 18–24, so apply the town's share of women aged 15–79 (40.4% in Auxerre, i.e. 14,190 ÷ 35,097) to the grid total, and do not mix these tax-based counts with census counts.
From population to target population
Keep only the residents likely to buy your offer, with one defensible filter, not five stacked ones. Every extra filter shrinks the base and, if badly chosen, distorts it.
For the salon, the filter is sex and age: women aged 15 to 79. This is an assumption, to be backed by your own target customer profile (a men's or senior offer would change it).
Running example: the salon. From the INSEE Dossier complet (2023 census, released 27/08/2026, table POP T4):
- Auxerre: 35,097 residents, of whom 14,190 women aged 15–79.
- Auxerrois agglomeration community: 67,723 residents, of whom 27,044 women aged 15–79, so 12,854 outside Auxerre.
Step 3: estimate spending per person
Target population × annual spending per target person = theoretical market
Your theoretical local market is a SAM at the scale of your neighbourhood. If you also need the national picture, the method to size your market with TAM, SAM and SOM works from the other end, and the two should reconcile.
Where to find average spending for free
In the US, the BLS Consumer Expenditure Surveys (a household survey) publish average annual spending per consumer unit by category. In France, INSEE's national accounts break household consumption down by product: its Household consumption in 2025 tables (released 29/05/2026), file "T_CONSO_EFF_PRODUITS", sheet "MEURcour" (current-price millions of euros), have a separate line for "Soins de beauté" (beauty treatments, code H_S96Z3), distinct from hairdressing. The 2025 value, provisional: €4,569.9 million.
Divide it by the national population matching your filter. The INSEE file for France as a whole (2023 census) counts 26,815,316 women aged 15 to 79. That gives about €170 per woman aged 15–79 per year.
Write down two assumptions: all national spending is attributed to the target population (men buy beauty treatments too, but the bias cancels out because the same rule applies nationally and locally), and the gap between spending year (2025) and population year (2023) is ignored.
Adjust for the zone's profile
A wealthier area spends more on discretionary services, and vice versa. The median income of the zone against the national median gives you a coefficient (in the US, median household income from the American Community Survey).
Running example: the salon. Median living standard in 2023: €22,700 in Auxerre, €25,250 for the agglomeration community, against €25,840 for metropolitan France and La Réunion. Assumptions: coefficient 0.88 in the primary zone (22,700 ÷ 25,840) and 1.0 in the secondary zone (the agglomeration community is close to the national median, and it is the main town that pulls it down).
- Primary theoretical market: 14,190 × €170 × 0.88 = €2,122,800
- Secondary theoretical market: 12,854 × €170 × 1.0 = €2,185,200
Step 4: list the competitors in the zone
Three free sources to cross-check
- The official business register, filtered by activity code and municipality, active establishments only. In France, the Annuaire des entreprises (activity code 96.02B, "beauty treatments"). The search shows a count of companies (53 in Auxerre): count the active establishments located in the town. In the US, the Census Business Builder shows establishment counts by industry for the area (employer businesses only, so home-based sole traders are missing). The French register, by contrast, also counts home-based sole traders and dormant companies.
- Equipment or business-pattern databases, to compare your town's density with neighbouring ones.
- Google Maps and booking platforms: this is where you check who really has a storefront, what they offer, their prices and reviews.
The ratio lenders understand
Divide the target population by the number of competing establishments in your zone, and compare it with the same ratio for the wider region. An under-served zone is an argument. An over-served zone requires a clear positioning. The real figures of established competitors then help calibrate your capture rate: learn how to analyse your competitors' financials from the accounts they file, when they publish them.
The count stops here. Comparing offers, prices and positioning belongs to the competitive analysis grid, which you fill in with the list you have just built.
Running example: the salon. Annuaire des entreprises, code 96.02B, active establishments, search of October 2026: 41 in Auxerre, 39 in the 28 other communes of the agglomeration community, 328 in the Yonne department.
- Auxerre: 14,190 ÷ 41 = 346 women aged 15–79 per establishment.
- Rest of the agglomeration community: 12,854 ÷ 39 = 330.
- Yonne: 128,205 women aged 15–79 (INSEE, 2023 census) ÷ 328 = 391.
The Auxerre area is slightly better served than the department: no gap to fill, so the offer needs to stand out. The register does not say how many of these 41 have a storefront. Working assumption: 18 salons with a shopfront, the rest working from home or at clients' homes. Replace this with your own count on site.
Step 5: leakage, capture rate and revenue
Theoretical market × (1 − leakage rate) = available market in the zone
Available market × capture rate = revenue potential
Remove leakage
Leakage is the spending of the zone's residents that happens outside the zone: near their workplace, in a larger nearby city, online. The French public business-creation agency Bpifrance Création builds it explicitly into its market-share method ("purchases made outside the zone").
No free database gives this rate by town and activity. Estimate it with a simple question asked to around a hundred potential customers: "Where did you have your last treatment?" The reverse also exists: inflow (workers, tourists) who come to spend in your zone. The "Adapting" section covers it.
Set a capture rate you can defend
No guesswork. Cross three anchors:
- The fair share in the primary zone: 1 ÷ (number of competitors + 1). This is a ceiling: the share you would get if customers split equally between all salons, yours included.
- The ramp-up: in year one, use a fraction of that ceiling, justified by your location, your offer and your starting awareness.
- A lower share in the secondary zone, where customers have salons closer to home.
The Bpifrance example shows the mechanics: a local market of €2 million, a 5% target share, €100,000 of first-year revenue. It also shows the risk: on a €2 million market, one point of capture rate is worth €20,000. That is the line your lender will challenge.
Running example: the salon. Leakage assumptions: 15% in the primary zone, 20% in the secondary zone (customers who work outside the area or go to a larger city), to be confirmed with the street question above. Primary ceiling: 1 ÷ (18 + 1) = 5.3%. Year-one share, central scenario: 2.5% (about half the ceiling). Secondary zone: 0.8% (about a third of the primary share).
| Zone | Target population | Spending / person | Theoretical market | Leakage | Available market | Capture rate | Revenue potential |
|---|---|---|---|---|---|---|---|
| Primary (Auxerre) | 14,190 | €170 × 0.88 | €2,122,800 | 15% | €1,804,400 | 2.5% | €45,100 |
| Secondary (rest of the agglomeration community) | 12,854 | €170 × 1.0 | €2,185,200 | 20% | €1,748,100 | 0.8% | €14,000 |
| Total | 27,044 | €4,308,000 | €3,552,500 | €59,100 |
Step 6: check the figure against capacity and the street
The capacity test
Capacity = practitioners × working days × treatments per day × average price
If the capturable market exceeds your capacity, capacity sets the revenue. If it falls far short, the premises or the team are oversized. Reconciling demand and supply is the basis of your revenue forecast, which adds a third method based on comparables.
The street test
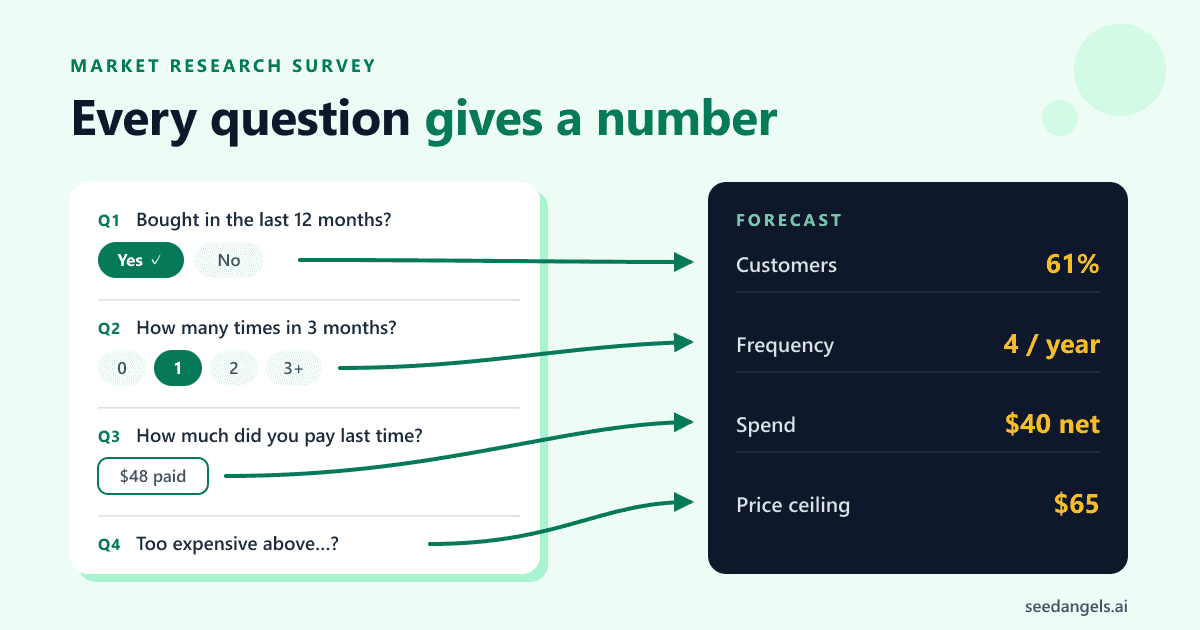
Count passers-by in front of the premises at several times (Tuesday morning, Saturday afternoon), then ask a few dozen passers-by and future customers where they live, how often they go, what they spend and where they go today. Their answers validate your primary zone and leakage rate. To phrase them without bias, use these market research survey questions.
Running example: the salon. Capacity assumptions: 2 practitioners × 235 days × 6 treatments a day × €45 average price = €126,900 at full occupancy. The central "market" revenue (€59,100) means about 47% occupancy. Reading: the market does not fill both rooms in year one. Either you justify a fast ramp-up, or the employee starts part-time.
The full calculation in one table
| Input | Value | Source or status |
|---|---|---|
| Primary zone | Commune of Auxerre | Approximation of the 10-min isochrone (mapping assumption) |
| Secondary zone | 28 other communes of the agglomeration community | Approximation of the 20-min isochrone (mapping assumption) |
| Women aged 15–79, Auxerre | 14,190 | INSEE, Dossier complet, 2023 census, released 27/08/2026 |
| Women aged 15–79, rest of the agglomeration community | 12,854 | INSEE, Dossier complet (agglomeration community), 2023 census (27,044 − 14,190) |
| National spending on beauty treatments | €4,569.9m (2025, provisional) | INSEE, Household consumption in 2025, line H_S96Z3 |
| Women aged 15–79, France | 26,815,316 | INSEE, Dossier complet France, 2023 census |
| Spending per woman aged 15–79 | €170 / year | Calculation |
| Income coefficient | 0.88 primary / 1.0 secondary | INSEE Filosofi 2023 + assumption |
| Leakage | 15% / 20% | Assumption, to validate on the street |
| Active salons in the register, Auxerre | 41 | Annuaire des entreprises, code 96.02B, October 2026 |
| Salons with a shopfront, Auxerre | 18 | Assumption, to replace with a count |
| Primary capture rate | 1.8% / 2.5% / 3.5% | Assumption (ceiling 5.3%) |
| Secondary capture rate | 0.5% / 0.8% / 1.2% | Assumption |
| Year-one revenue | €41,200 / €59,100 / €84,100 | Low / central / high |
The sentence to write in the business plan. "Our trade area has 27,044 women aged 15 to 79 (INSEE, 2023 census), for a theoretical beauty treatment market of €4.3m a year. After leakage, we target 2.5% of the available market in the primary zone and 0.8% in the secondary zone, giving €59,100 of first-year revenue, within a range of €41,200 to €84,100. This represents 47% of our capacity."
The beauty salon business plan template shows where this analysis sits in the plan, between the project description and the forecast.
These assumptions go straight into SeedAngels, which turns them into the income statement, cash flow plan and financing plan.
Adapting the method: restaurant, cottage, hotel
Restaurant: count workers and passers-by too
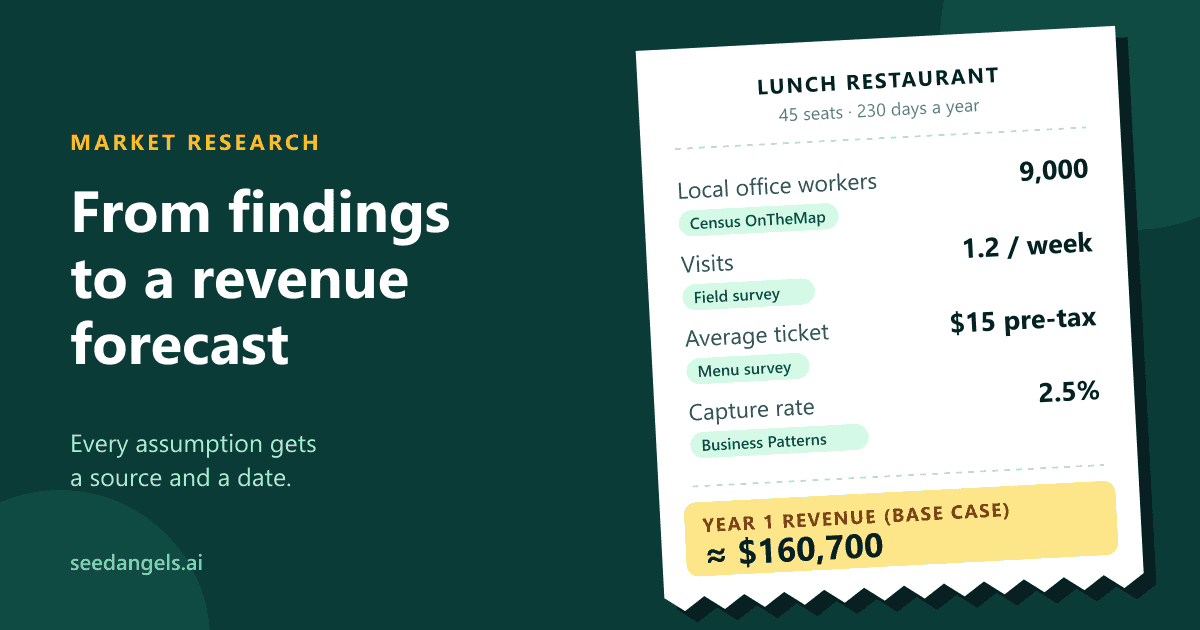
At lunchtime, the population that matters is not who lives in the zone but who works there: jobs at place of work, which the census publishes (in Auxerre, INSEE counts 25,486 in 2023, for 35,097 residents). In the evening and at weekends, it is residents. So run two separate calculations, lunch and dinner, with two different zones: a few minutes' walk for lunch, wider in the evening. Add passing trade (station, shopping street) if your location depends on it. The restaurant business plan template shows how it translates into covers and revenue.
Cottage and hotel: the zone is the destination
For accommodation, demand comes from outside. Counting residents makes no sense. Start from the destination's tourist visits, then the competing supply, then a target occupancy rate. In France, INSEE's tourist accommodation capacity by commune (2026 data) gives the number of hotels, rooms, campsites and other collective accommodation per town; regional tourism observatories publish overnight stays. The cottage business plan template shows where these destination figures sit in the plan.
For a hotel, the destination study leads to an occupancy rate, which goes straight into the revenue formula: rooms × average daily rate × occupancy × 365. That is how the hotel business plan template is built.
| Business | What replaces the resident population | Where to find it |
|---|---|---|
| Restaurant (lunch) | Jobs at place of work in the zone | Census employment data by area |
| Restaurant (dinner) | Residents + passing trade | Census + on-site count |
| Cottage, hotel | Overnight stays and competing capacity at the destination | Tourism statistics, regional tourism observatory |
Mistakes that skew a trade area analysis
- The compass circle. A 1-mile ring ignores the railway and the missing parking. Use an isochrone.
- Total population instead of target population. 35,097 residents are not 35,097 customers.
- Unadjusted national spending. A town whose median income is 12% below the national median does not spend like the average.
- Forgetting leakage. Your zone's residents do not spend everything in your zone.
- A capture rate with no anchor. Without a ceiling or a justification, it is the first number a lender challenges.
- Counting competitors from the register without checking on site. 41 registered establishments are not 41 shopfronts.
- One figure with no range. A single number with no low case signals that risk was not looked at. It is one of the first things a bank checks in your financial forecast.
- Undated sources. State the year of every data point.
Joining a franchise? In France, the franchisor must give you a presentation of the general and local state of the market in the pre-contract disclosure document (article R330-1 of the Commercial Code, implementing article L330-3). That document does not replace your own analysis: redo the calculation yourself, with your own capture-rate assumptions.
Conclusion
A sound trade area analysis fits on one page: a map, four sourced figures (target population, spending per person, competitors, capture rate) and a revenue range. Everything else is presentation.
The Auxerre example shows what makes the result solid: every public figure is dated, every assumption is labelled as one, and the final number is tested against the business's real capacity. A lender can dispute an assumption; they cannot dispute reasoning they can see in full.
Redo the calculation whenever the location changes: two streets away, the zone, the competitors and the capture rate are no longer the same. Once your assumptions are set, build the business plan and forecast that follow from them with SeedAngels. Try SeedAngels for free →
FAQ
What is a trade area?
A trade area is the geographic area that a store draws most of its customers from. It is usually split into a primary zone (the closest, most loyal customers), a secondary zone and a tertiary zone, based on travel time. It is used to count potential customers and estimate the revenue a new business can reach, which is why lenders expect it in a business plan.
How do you define a trade area for free?
Draw a drive-time or walk-time map (an isochrone) around your location with openrouteservice, which is free to use (its free API allows 500 isochrones a day). Then pull the population, households and income of that area from your national statistics office: the Census Business Builder in the US, INSEE's local data tools in France. Adjust the outline by hand for railways, highways, rivers and parking.
What is the difference between a radius ring and a drive-time trade area?
A radius ring is a circle of fixed distance around the store, for example one mile. A drive-time or walk-time area covers the places that can reach the store within a given time on the real road network. Drive-time is more accurate whenever a railway, highway, river or lack of parking cuts the circle, which is the case in most town centres.
How do you estimate revenue from a trade area?
Multiply the target population of each zone by its average annual spending in your category: that is the theoretical market. Remove the spending leakage (money spent outside the area), then apply a capture rate justified by the number of competitors and your positioning. Calculate each zone separately, add them up, and check the result against your production capacity.
What is retail leakage?
Leakage is the share of the spending of an area's residents that happens outside the area: near their workplace, at a mall in a bigger town, or online. It is removed from the theoretical market before you estimate your share. High leakage can also signal that local supply is missing, which is an opportunity for a well-positioned new business.
What market share should a new store expect in its trade area?
There is no standard rate. Start from a ceiling, the fair share (one divided by the number of competitors plus one) in the primary zone, then use a fraction of that ceiling in year one while you build awareness. Plan a lower share in the secondary zone. What matters to a lender is that every rate is justified.