An empty canvas teaches you nothing
You have seen the nine-box diagram a dozen times, but nobody has shown you what a finished Lean Canvas looks like for a project your size. Online templates are blank. The "filled-in" examples are Uber's or Airbnb's, rebuilt fifteen years after their success, when every answer is already known. They do not help someone who is starting from an idea and has to decide what to write in the "problem" box tonight.
This article does the opposite. It fills in three complete Lean Canvases for three realistically sized projects: a SaaS product sold to businesses, a restaurant, and a marketplace connecting two kinds of customers. For each box you will see what goes in it, what backs it up, and the mistake people make most often. The three companies are fictional; the context figures are sourced.
By the end, you will know the order to fill in the nine boxes, how much detail each needs, and how to tell a solid box from one that merely restates what you want to build.
What is a Lean Canvas?
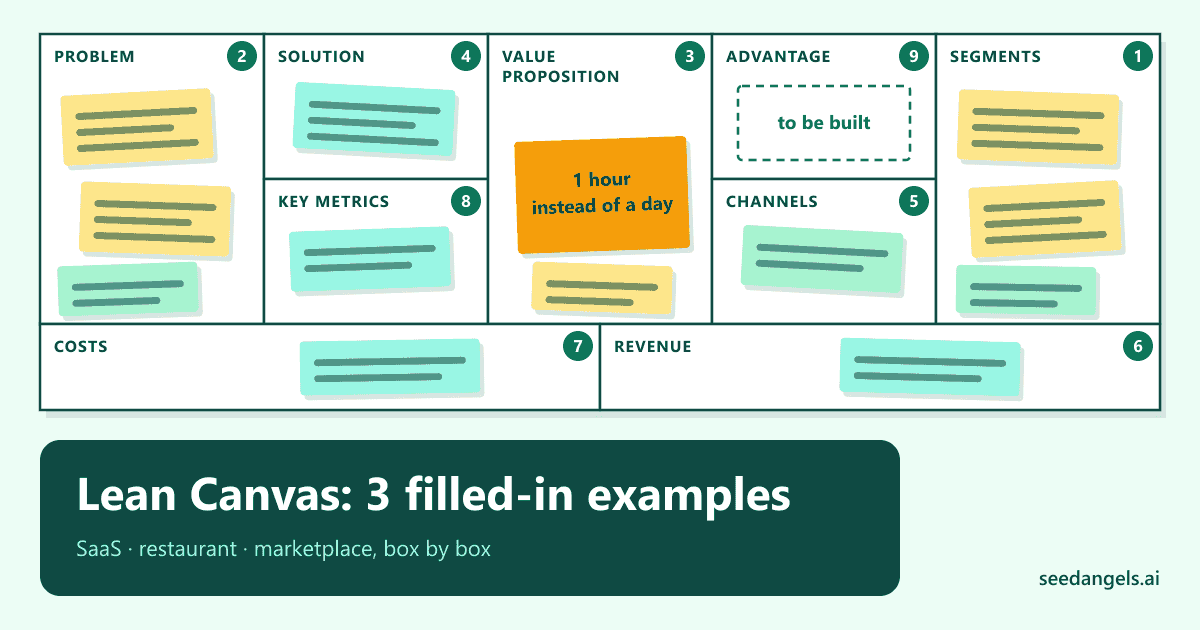
The Lean Canvas is a one-page template that describes a business idea in nine boxes, from the customer's problem to what protects the company. Created in 2010 by Ash Maurya from the Business Model Canvas, it is used to write down your starting assumptions so you can test them one by one, before investing time and money.
Its nine boxes:
- Problem: the customer's top one to three problems, and what they use today to get by.
- Customer segments: who has the problem, and above all who has it badly enough to try something new (the early adopters).
- Unique value proposition: in one sentence, what the customer gets and why it is different.
- Solution: the three or four features that address the problems.
- Channels: how you reach your customers.
- Revenue streams: who pays, how much, how often.
- Cost structure: what it costs to exist and to serve one customer.
- Key metrics: the three to five numbers that tell you whether the project is moving.
- Unfair advantage (or competitive advantage): what a competitor cannot easily copy or buy.
How it differs from the Business Model Canvas
Strategyzer's Business Model Canvas, from the book Business Model Generation, describes a company whose customer is already known. The Lean Canvas swaps four of its boxes for start-up questions: in place of key partners, key activities, key resources and customer relationships, you find the problem, the solution, the key metrics and the unfair advantage. The other five boxes are shared by both. For a project still looking for its market, the Lean Canvas is the one to fill in first.
In what order to fill in the boxes
Sources disagree on the order, and that is the first thing that gets people stuck. LEANSTACK, Ash Maurya's company, says there is no right order and suggests, as a fallback, starting with customer segments and ending with the unfair advantage; other guides start with the problem; some courses have you write the value proposition first, others last. The disagreement is only apparent: some follow the order in which you understand a project, others the order in which you are most likely to be wrong.
The order we use in the three examples starts from the customer and ends with what protects the business:
- Customer segments and problem, together: you cannot describe a problem without saying who has it.
- Existing alternatives, in the problem box: what those customers do today.
- Unique value proposition, first draft.
- Solution: three or four features, one per problem.
- Channels: how to reach the early adopters, not the whole market.
- Revenue streams: price, frequency, who pays.
- Cost structure: fixed costs, then the cost of serving each customer.
- Key metrics: three to five, measurable from the first month.
- Unfair advantage, then a rewrite of the value proposition.
LEANSTACK recommends sketching the first version in under 20 minutes. That is deliberate: the first canvas puts your assumptions on the table, it does not prove them. The evidence comes next, and that is what separates the three examples below from a form-filling exercise. To practise on your own idea before reading the examples, the free Lean Canvas generator starts from a few lines of description and, once you create a free account, drafts the nine boxes, which you can then hold up against the examples.
Example 1: a B2B SaaS (Paramedic)
The project: Paramedic is scheduling and time-tracking software for home care agencies, the businesses that send caregivers into the homes of elderly and disabled clients. The company is fictional: it is the demo project behind our SaaS pitch deck template, which shows where this canvas leads once it has numbers, with its market, competitors and seed round. The market is real: the U.S. Bureau of Labor Statistics counted 4.68 million home health and personal care aide jobs in 2025, with 18% growth projected through 2035.
The third column shows the kind of evidence that should back each box: public data where it exists, otherwise interviews or field checks to run.
| Box | What goes in it | What backs it up |
|---|---|---|
| Customer segments | Private home care agencies. Early adopters: agencies with 20 to 80 caregivers whose coordinator schedules on spreadsheets and by phone. Users: coordinator and caregivers. Payer: the owner. | State agency directories; interviews with owners and coordinators. |
| Problem | 1. The schedule gets redone several times a week because of absences and replacements. 2. Some hours worked are never billed, or are billed late. 3. Caregivers learn about shift changes at the last minute. Alternatives: spreadsheets + calls + texts; existing agency software. | Accounts in professional groups and trade press; interviews. |
| Unique value proposition | Next week's schedule done in one hour, and every hour worked billed. | The two problems that cost the owner money, to confirm in interviews. |
| Solution | Drag-and-drop scheduling with suggested replacements; a mobile app for caregivers, with clock-in; export of hours worked to billing. | One feature per problem; features listed on 5 competitors' websites (AxisCare, AlayaCare, WellSky Personal Care, eCaring, Logicly). |
| Channels | Video demos for owners; trade associations and industry events; content on trade searches ("home care scheduling"); owner-to-owner referrals. | Where owners say they get their information, to ask in interviews. |
| Revenue streams | Essential plan at $59 a month, Advanced at $139 a month. Assumption to test: paid onboarding. | Competitors' pricing pages; willingness to pay tested in interviews. |
| Cost structure | Fixed: product and engineering salaries, hosting that meets privacy rules for client health data (check whether HIPAA applies). Variable: support and onboarding per customer, acquisition cost. | Hosting quotes, salary benchmarks. |
| Key metrics | Share of trial agencies that publish a real schedule in week one; monthly churn; hours billed through the tool over hours scheduled; acquisition cost per customer. | Standard SaaS metrics, adapted to the trade. |
| Unfair advantage | Copyable: features, price, design. To be built: field knowledge from a team that comes from the industry, and switching costs once schedules and history live in the tool. | Analysis of the 5 competitors. |
The reasoning, box by box
Segments and problem. The first draft said "home care agencies". That is a market, not a segment: an agency with 400 employees often already has agency software and someone to run it, while an agency with 30 caregivers has a coordinator and a spreadsheet. The canvas targets the second. It also separates the users (the coordinator, the caregivers) from the payer (the owner), because they will not be won over by the same arguments. The classic mistake: a segment so broad that nobody can be called on Monday morning.
Problem. Each problem is described from the point of view of the person living it, with its frequency ("several times a week"). The alternatives line is the most useful one in the canvas: for the early adopter, Paramedic's real competitor is the spreadsheet, not another product. The classic mistake: writing "lack of a suitable tool", which is the solution dressed up as a problem.
Value proposition. It promises an outcome the owner can check (one hour, hours billed), not a technology. The classic mistake: "an intuitive, collaborative all-in-one platform", which could describe a thousand products.
Solution. Three features, one per problem. The rest (reports, messaging, time-off management) waits until the first three are in use. The classic mistake: a list of fifteen features, which shows that nothing has been chosen.
Revenue streams. Prices come from competitors' pricing pages and from interviews, not from a hunch. Price is not presented as a differentiator: a competitor can match it in a day.
Key metrics. Trial sign-ups are not on the list: that number always goes up and proves nothing. Activation (a real schedule published) and churn measure whether the tool is used. They are also the metrics investors check first on a SaaS company, with their thresholds, once the canvas turns into a forecast. The classic mistake: vanity metrics (visits, sign-ups, followers).
Unfair advantage. The box is honest about what can be copied. What is left (industry expertise, switching costs) is marked "to be built". The classic mistake: "our UX", which a funded competitor reproduces in six months.
Example 2: a restaurant (Partie Pizza)
The project: Partie Pizza sells Roman-style pizza by the slice in downtown Philadelphia, with a lunch combo and whole pies delivered in the evening. The company is fictional; it is also the demo project behind our restaurant pitch deck template, with its local competitors and three-year forecast.
| Box | What goes in it | What backs it up |
|---|---|---|
| Customer segments | Office workers in a hurry at lunch (early adopters: offices within a 5-minute walk); students; groups in the evening and at weekends. | Foot traffic counted between 12 and 2 pm in front of the target space, over several days. |
| Problem | 1. Eating decently for under $12 in under 10 minutes is hard downtown. 2. Fast options are mostly sandwiches and chains. Alternatives: delis, fast-food chains, delivery apps, packed lunch. | Menus and prices of the competitors on the block; observed queues. |
| Unique value proposition | A slice of Roman-style pizza served in under 3 minutes, an $11 lunch combo. | Time and price, the two criteria to confirm with local office workers. |
| Solution | Par-baked slices reheated to order; a two-slice lunch combo; whole pies to go and delivered in the evening. | The concept answers both problems; evenings answer the groups segment. |
| Channels | The location and its storefront; the Google Business profile and reviews; delivery apps in the evening; offers for nearby offices. | Counted foot traffic; competitors' Google profiles and review counts. |
| Revenue streams | Slice at $5.25; two-slice lunch combo at $11; whole pie to go at $24; evening delivery orders. | Prices checked at the competitors. |
| Cost structure | Fixed: rent, wages, loan repayments for the oven and fit-out. Variable: food cost, packaging, delivery app commissions. | Proposed lease, supplier quotes, delivery app rate cards. |
| Key metrics | Covers per day; average ticket; food cost as a % of revenue; share of delivered sales (and their margin after commission). | The ratios restaurant operators track. |
| Unfair advantage | None at the start, and the canvas says so. Leads: a prime location secured by a lease, a base of lunch regulars. | Competitor analysis. |
What changes for a local business
A restaurant is not filled in like software, and three boxes change in nature.
Evidence for the problem comes from the sidewalk, not from forums. You do not prove that a neighborhood lacks fast lunches by reading threads online: you count passers-by at noon, time the queues, note the prices on display. The evidence is modest, but nobody can dispute it.
The main channel is the location. For Partie Pizza, the channels box and the cost box are about the same thing: the space. Higher rent on a busy street can cost less than an acquisition campaign for a space tucked away. The classic mistake: "social media" as the main channel of a neighborhood restaurant.
The metrics are the trade's. No MRR, no churn: covers, average ticket, food cost. Food cost needs particular watching on delivered sales, where the app's commission eats part of the margin.
The unfair advantage is often empty, and that is normal. A recipe gets copied, a talented pizzaiolo gets poached. Writing "none yet" and naming what could become one (the lease, the regulars) is more credible than "unique know-how". The classic mistake: confusing product quality, which is a requirement, with an advantage.
Example 3: a marketplace (Field to Counter)
The project: Field to Counter is a platform that connects farms within 50 miles of a mid-sized city with independent restaurants: one order, one delivery, one invoice. The company is entirely fictional. It has two kinds of customers, and that is what makes its canvas different: each box is filled in twice, on the supply side (the farms) and on the demand side (the restaurants).
On the supply side, the pool exists: in the 2022 Census of Agriculture, 60,332 U.S. farm operations sold directly to retailers, institutions or intermediaries, for $14.2 billion, more than double the number in 2017, according to the USDA's Economic Research Service. The question is not whether farms sell direct, but whether they want to sell to restaurants through a middleman.
| Box | Restaurant side (demand) | Farm side (supply) |
|---|---|---|
| Customer segments | Independent restaurants that advertise "scratch-made" or local. Early adopters: chef-owners with 30 to 80 seats who already buy from 2 or 3 farms directly. | Vegetable growers, livestock farmers and cheesemakers already selling direct. Early adopters: those who already deliver to a few restaurants. |
| Problem | Six farms means six calls, six delivery windows and six invoices; the week's availability is unknown. Alternatives: broadline distributors (Sysco, US Foods), calling farms directly, the farmers' market. | Small, scattered orders, delivery runs that barely pay, chasing payments. Alternatives: delivering themselves, selling only at markets. |
| Unique value proposition | Your local farms in one order, one delivery, one invoice. | Orders from ten restaurants on one delivery run, paid within 7 days. |
| Solution | Catalogue of the week's availability; group order before Tuesday; single invoice. | Availability entered in 5 minutes; shared delivery run; guaranteed payment. |
| Channels | Direct visits to restaurants; restaurant associations; a chef ambassador who talks to peers. | Pilot restaurants bring in their own farms; farmers' markets; local farm networks. |
| Revenue streams | Delivery fee per order (assumption). | 10 to 15% commission on sales (assumption to check against farm margins). |
| Cost structure | Logistics (refrigerated van, driver), the main variable cost; building the platform; acquiring both sides. | |
| Key metrics | Share of ordered items actually delivered; orders per restaurant per month; 30-day repeat rate. | Farms active each week; logistics cost per order. |
| Unfair advantage | To be built: local density (enough farms and restaurants in one area to fill every run). Today, none. |
The chicken-and-egg problem
A marketplace with no farms interests no restaurant, and a marketplace with no restaurants interests no farm. The canvas has to say which side comes first, and you can read it in the channels.
Field to Counter starts with demand, but narrow demand: ten restaurants that commit in writing to one order a week, then their own farms, recruited through them. The farms arrive with a customer already won, which settles the question of trust. The scope stays small (vegetables and dairy, one delivery area) until every run is full.
That is why the first metric is not the number of sign-ups but liquidity: the share of ordered items that are actually delivered. A restaurant that orders zucchini and receives none does not come back.
The classic mistakes in this canvas: setting the commission before measuring farm margins, which drives supply away; writing "network effects" in the unfair advantage box when there is neither a network nor liquidity yet; and filling a single "customers" box that mixes two audiences whose problems have nothing in common.
The 3 canvases side by side
| B2B SaaS | Restaurant | Marketplace | |
|---|---|---|---|
| Evidence for the problem | Interviews, professional groups, trade press | Foot-traffic counts, prices, queues | Interviews on both sides, written commitments |
| Main channel | Demos, professional network | Location | Direct outreach, one side brings the other |
| Revenue | Monthly subscription | Ticket per customer | Commission and delivery fees |
| Metric no. 1 | Activation, then churn | Covers per day and food cost | Liquidity (orders filled) |
| Plausible advantage | Switching costs, industry expertise | Location, regulars | Local density (network effect to be built) |
The format is the same, but the box that decides everything changes: the problem for the SaaS (if it does not hurt enough, nobody switches tools), channels and costs for the restaurant (the space drives the revenue), and the balance between the two sides for the marketplace. Find your project's critical box: that is the one to prove first.
The mistakes that come back in every box
| Box | Mistake | The test that catches it |
|---|---|---|
| Problem | Writing the solution in the negative ("lack of a tool for…") | Would the problem exist if your product had never been invented? |
| Segments | "SMBs", "young people", "everyone" | Can you name ten people to call tomorrow? |
| Value proposition | A feature list or an adjective ("intuitive") | Does a customer understand in 5 seconds what they get? |
| Solution | Fifteen features | Does each feature answer a problem from box 1? |
| Channels | "Social media" and "word of mouth", unspecified | Roughly how much does one customer cost through this channel? |
| Revenue | A price chosen to be "cheaper than competitors" | Does the price hold if a competitor matches it tomorrow? |
| Costs | Launch costs only | Do you know what one more customer costs? |
| Key metrics | Visits, sign-ups, followers | Can the metric go down when the project is going badly? |
| Unfair advantage | "Our team", "our passion", "our price" | Could a competitor copy or buy it with time or money? |
The last test is the one LEANSTACK quotes from Jason Cohen: a real unfair advantage is "something that cannot be easily copied or bought". To go further on this box, our guide explains how to tell a competitive advantage from a mere difference, and how to build a barrier when you do not have one yet.
From canvas to evidence
A filled-in Lean Canvas is still a list of assumptions. Steve Blank put it plainly in the Harvard Business Review in 2013: a start-up does not begin by executing a plan, it searches for a business model that works. The canvas tells you what to look for; it does not tell you whether it is true.
The next step is to rank the boxes by risk and test the riskiest first. As LEANSTACK notes, it is rarely the solution: you usually know how to build the product, you do not know whether anyone will pay for it. For Paramedic it is the problem (will owners switch tools?); for Partie Pizza, the location; for Field to Counter, liquidity. To turn those assumptions into evidence, the method is to validate a business idea in four stages, with a measurable threshold at each, from the first interviews to the first commitments.
This is also where a documented canvas saves time. In SeedAngels, the Lean Canvas feature starts from a few sentences about your idea: the tool restates the problems and lists three to six real competitors, which you correct before going further, tests the problem against forums, press and communities rather than marketing pages, then writes the nine sections, attaching every claim to the source it came from. It does not replace customer interviews or first payments: your edits take priority over its analysis, and an advantage box can perfectly well stay "to be built".
Conclusion
A good Lean Canvas is not recognised by how well it is worded, but by what stands behind each box. The three examples follow the same order (customers and their problem first, unfair advantage last) and the same discipline: a segment you can call, a problem described by the person who lives it, metrics that can go down, and an advantage box that dares to say "to be built". What changes from one project to the next is the box you have to prove first.
Fill in your first version in twenty minutes, find your critical box, and spend the following weeks proving it rather than rewording it. To get started, the free Lean Canvas generator takes your idea: SeedAngels turns it into the nine boxes, documented with their sources, then into your forecast, business plan and pitch deck. Try SeedAngels for free →
FAQ
What is a Lean Canvas?
A one-page template that describes a business idea in nine boxes: problem, customer segments, unique value proposition, solution, channels, revenue streams, cost structure, key metrics and unfair advantage. Created by Ash Maurya in 2010 from the Business Model Canvas, it is meant for writing down your assumptions before testing them, not for describing an established company.
In what order should you fill in a Lean Canvas?
Start with customer segments and their problems, together, along with the alternatives they use today. Then write the value proposition, the solution, channels, revenue streams, costs, key metrics and the unfair advantage. Rewrite the value proposition at the end: it is the hardest box, and it gets clearer once the others are filled in.
How long does it take to fill in a Lean Canvas?
Under 20 minutes for the first version, according to LEANSTACK, Ash Maurya's company. The point is to write down your assumptions, not to prove them. The evidence then takes several weeks: interviews, field counts, competitors' pricing pages, first payments. A canvas polished for an afternoon and never tested in the field is worth no more than a 20-minute one.
What is the difference between the unique value proposition and the solution?
The value proposition says what the customer gets, from their point of view, in one sentence. The solution lists the three or four features that deliver on that promise. “Next week's schedule done in one hour” is a value proposition; “drag-and-drop scheduling and a mobile app for caregivers” is a solution.
What do you put in the unfair advantage box if you don't have one?
Nothing, or what could become one, marked “to be built”. An unfair advantage is something a competitor cannot easily copy or buy: a network, data, a community, rare expertise. Price, design and passion are not. An empty, honest box is better than an inflated one that an investor will take apart with a single question.
Do you need one Lean Canvas per customer segment?
Yes, when the segments have different problems. A marketplace has two sides, sellers and buyers, with distinct problems: you can keep them in one canvas by splitting each box, or make two canvases. A SaaS product that targets a single early-adopter profile first only needs one.
Lean Canvas or Business Model Canvas?
The Lean Canvas suits a project that is starting out and still looking for its market: it begins with the problem. The Business Model Canvas better describes a business whose customer is known and that depends on key partners and resources. Four boxes differ between the two; the other five are the same.